Building simple dashboards with Streamlit
MP 78: And not so simple ones as well!
Building dashboards used to be primarily the realm of data specialists. But these days the tooling has advanced so much that if you know the basics of Python, you can probably put together a pretty functional dashboard with just a little code.
I’ve been hearing about Streamlit for a while now, and I’ve been looking for a project where it would be appropriate to use it. I recently found such a project, and Streamlit is just as impressive to work with as I’d heard. In this post I’ll go over just enough to help you get started building your own dashboards with Streamlit on your own system.
In a followup post, I’ll show how to quickly deploy your dashboards so others can use what you’ve created. I’ll also share the real-world project I’ve been using Streamlit to implement.
What is Streamlit?
In order to understand Streamlit, we need to be clear about what we mean by a dashboard. In the programming world, a dashboard is a way to view the most important data about a system. It’s usually a snapshot of a system where the data can be changing rapidly. Or, it can be a static dataset that you can tweak by adjusting the input values.
Streamlit is a tool for building dashboards using Python. You focus on the kind of data you want to present and what you want users to be able to do with it, and the library handles the presentation aspect of the dashboard. It’s an open source tool, and the company that developed it has a platform where you can host your open source projects. Because it’s open source, you can also self-host your own dashboards.
When using Streamlit, you don’t need to deal with HTML, CSS, or JavaScript at all. You just write .py files, and then run your main file with the streamlit command. Streamlit starts up a server, and shows your dashboard in a browser tab.
Rolling Dice
To explore Streamlit, let’s make an app that lets you roll some dice. Once we get it working, we’ll add a few features to see the kinds of things that Streamlit lets you do.
Let’s get started by installing Streamlit, and making a file to work in:
$ python -m venv .venv
$ source .venv/bin/activate
(.venv)$ pip install streamlit
...
Successfully installed MarkupSafe-2.1.4...streamlit-1.30.0...
(.venv)$ touch roller.py
The main streamlit library includes a whole bunch of packages for working with data, including pandas, numpy, and a number of well-known plotting libraries.
Now let’s write some code in roller.py that simulates rolling a single 6-sided die:
from random import randint
import streamlit as st

roll = randint(1, 6)

f"You rolled a {roll}."
It’s conventional to import streamlit with the alias st. We use randint() to get a random integer between 1 and 6. Notice the last line is just a string; there’s no print() call, or anything else. When Streamlit finds a bare piece of data on a line, it presents that data on the dashboard if at all possible.
You run this program with the streamlit run command:
(.venv)$ streamlit run roller.py

      👋 Welcome to Streamlit!
      ...

  For better performance, install the Watchdog module:
  $ pip install watchdog
The first time you run streamlit, it will show a welcome message and ask you for your email. There’s also some telemetry practices you should read about. Briefly, they want to send some usage data to their servers when the streamlit server runs. You can write a two-line configuration file that prevents this telemetry from running:
[browser]
gatherUsageStats = false
The welcome message tells you where to save this file.
They also recommend you install watchdog, a package that helps libraries watch for changes in your source code files. I’ve installed watchdog to this virtual environment.
In addition to showing the welcome message, streamlit opens a new browser tab:
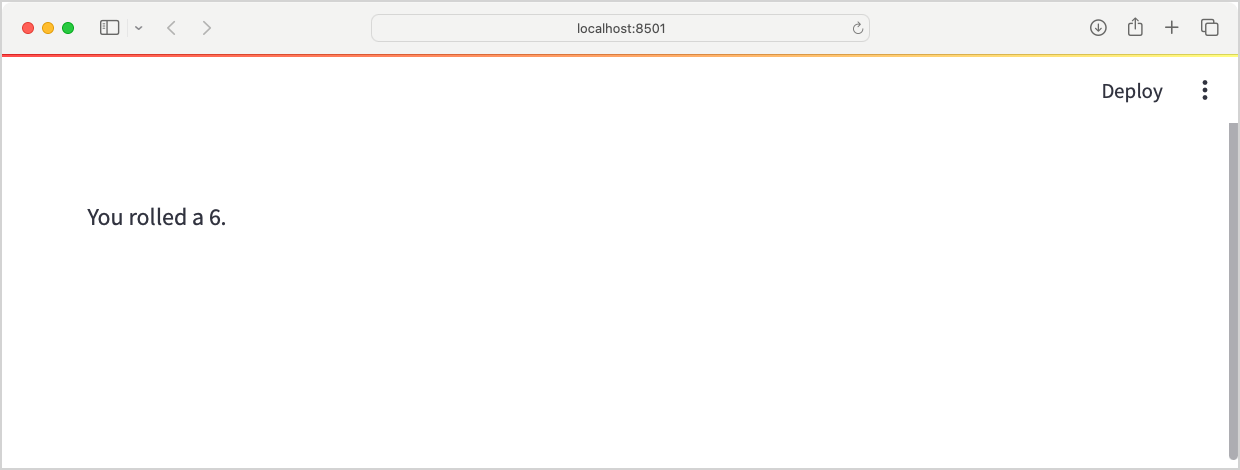
streamlit run command opens a new browser tab, with the dashboard displayed.This is the start of our dashboard; it shows the message from the last line of roller.py. If you refresh the page, you’ll get a different number.
The st.write() function
Streamlit comes with a bunch of functions for writing data to the dashboard. The first to be aware of is st.write(). This function can write a wide range of data to the dashboard such as strings, markdown, LaTex expressions, DataFrames, Python objects, chart objects, and more.
This version of roller.py has the same output that we just saw:
...
roll = randint(1, 6)

st.write(f"You rolled a {roll}.")
The first time you change your main .py file, you’ll see a number of options at the top of the dashboard:
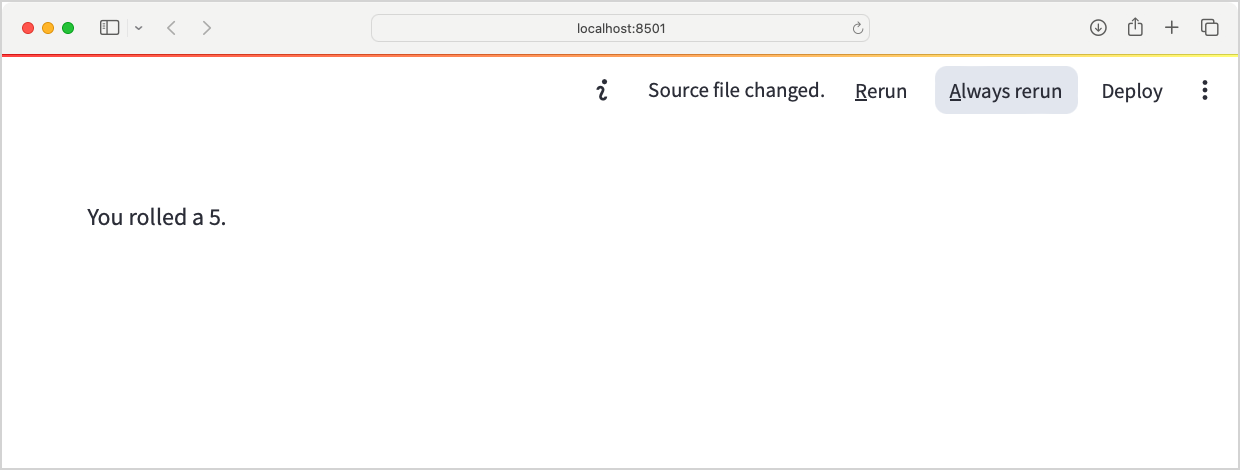
Streamlit noticed that your source code changed, and it wants to know what to do. You can rerun the file manually, or you can have Streamlit Always rerun the file when it notices a change. I’ve found this option to be useful so far in my own work.
Streamlit’s documentation is really easy to navigate. For a good place to start, check out the documentation page for st.write().
Input widgets: st.button()
It’s not very satisfying to have to reload the page in order to get a new roll. Let’s add a button that generates a new roll. Here’s how simple it is:
st.button("Roll")

roll = randint(1, 6)

st.write(f"You rolled a {roll}.")
This one line adds a button to the dashboard, with the label “Roll”. Streamlit re-runs your entire file every time the user interacts with an input element. Without attaching any code to this button, clicking it causes a new number to be rolled:
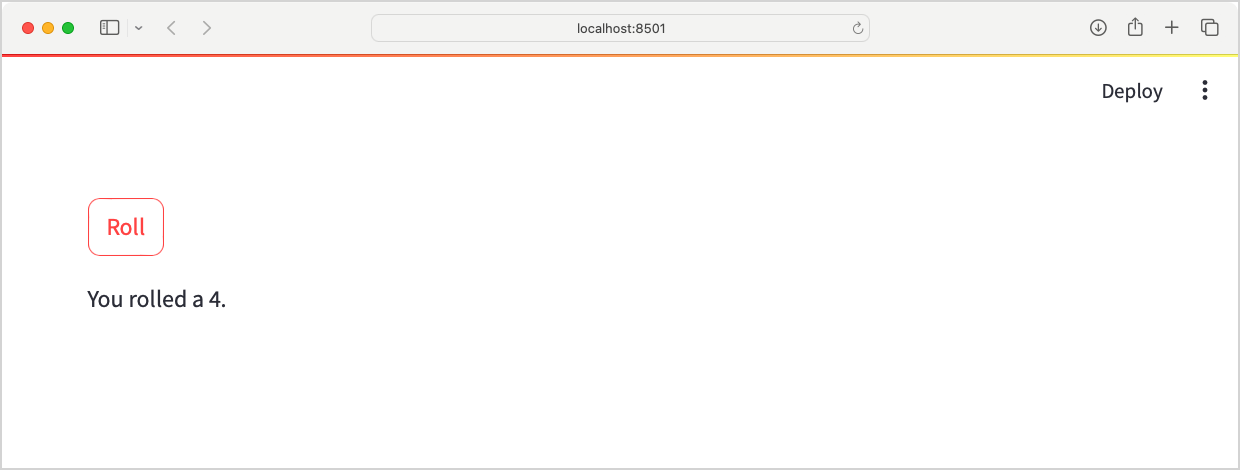
There’s a lot more you can do with buttons; check out the st.button() documentation page.
Input widgets: st.radio()
A dashboard with only one size die isn’t very useful, so let’s allow the user to choose what size die they’re rolling. We can do that with a radio select element:
side_options = [6, 10, 12, 20]
num_sides = st.radio("Number of sides:", side_options)

st.button("Roll")

roll = randint(1, num_sides)

st.write(f"You rolled a {roll}.")
This is where it starts to get interesting; we’re allowing the user to make choices that affect the values that appear on the dashboard. The side_options list defines what size dice the user can choose from. The st.radio() function generates a radio input element, and when the user selects a value it’s assigned to num_sides.
The call to randint() now uses num_sides as its upper limit:
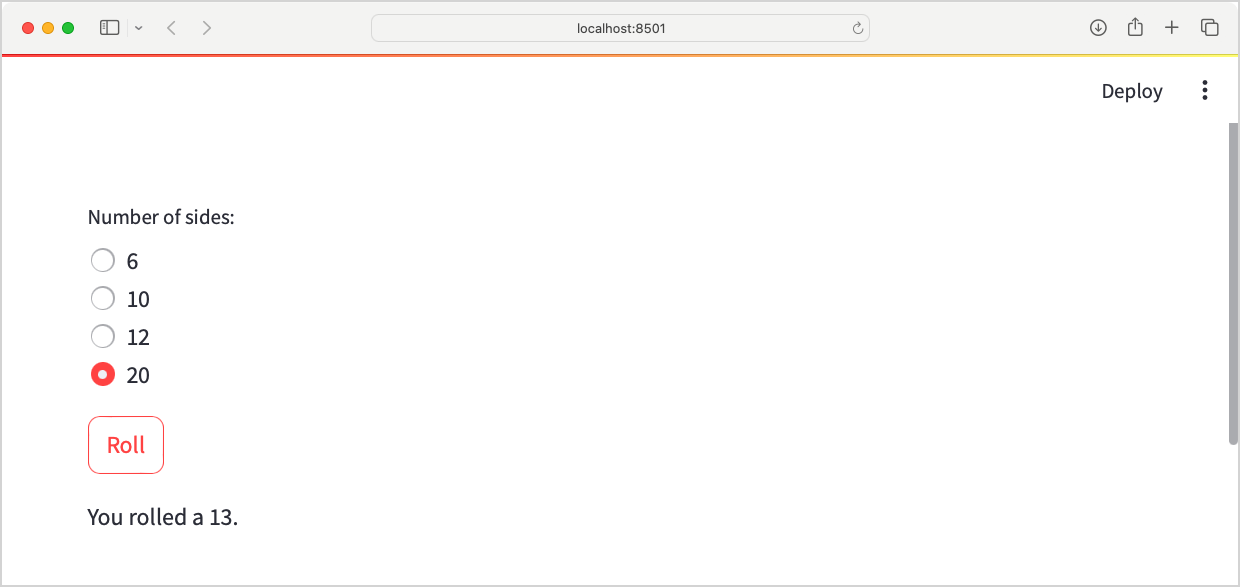
I wouldn’t say this looks like a dashboard yet, but it’s starting to look more interactive.
Input widgets: st.slider()
In most situations where you want to roll dice, you don’t just roll a single die. Let’s allow the user to choose how many dice they want to roll:
# Input widgets
side_options = [6, 10, 12, 20]
num_sides = st.radio("Number of sides:", side_options)
num_dice = st.slider("Number of dice:", 1, 10, value=2)

st.button("Roll")

# Roll calculation
rolls = [randint(1, num_sides) for _ in range(num_dice)]
roll = sum(rolls)

# Output message
st.write("---")
st.subheader(roll)
st.write(str(rolls))
There’s a little more going on here, because we’ve got more dice to manage. But the streamlit-specific elements are fairly straightforward. We use st.slider() to let the user choose the number of dice to roll, from one to ten.
Rather than one call to randint(), we move the randint() call into a comprehension that generates the correct number of rolls. The roll variable now reflects the sum of these individual values.
For the output, we use the fact that Streamlit presents string values as markdown by default to place a divider between the input section of the dashboard, and the summary. We use the st.subheader() function to make the most important piece of information stand out, and we print a string representation of the full list of rolls:
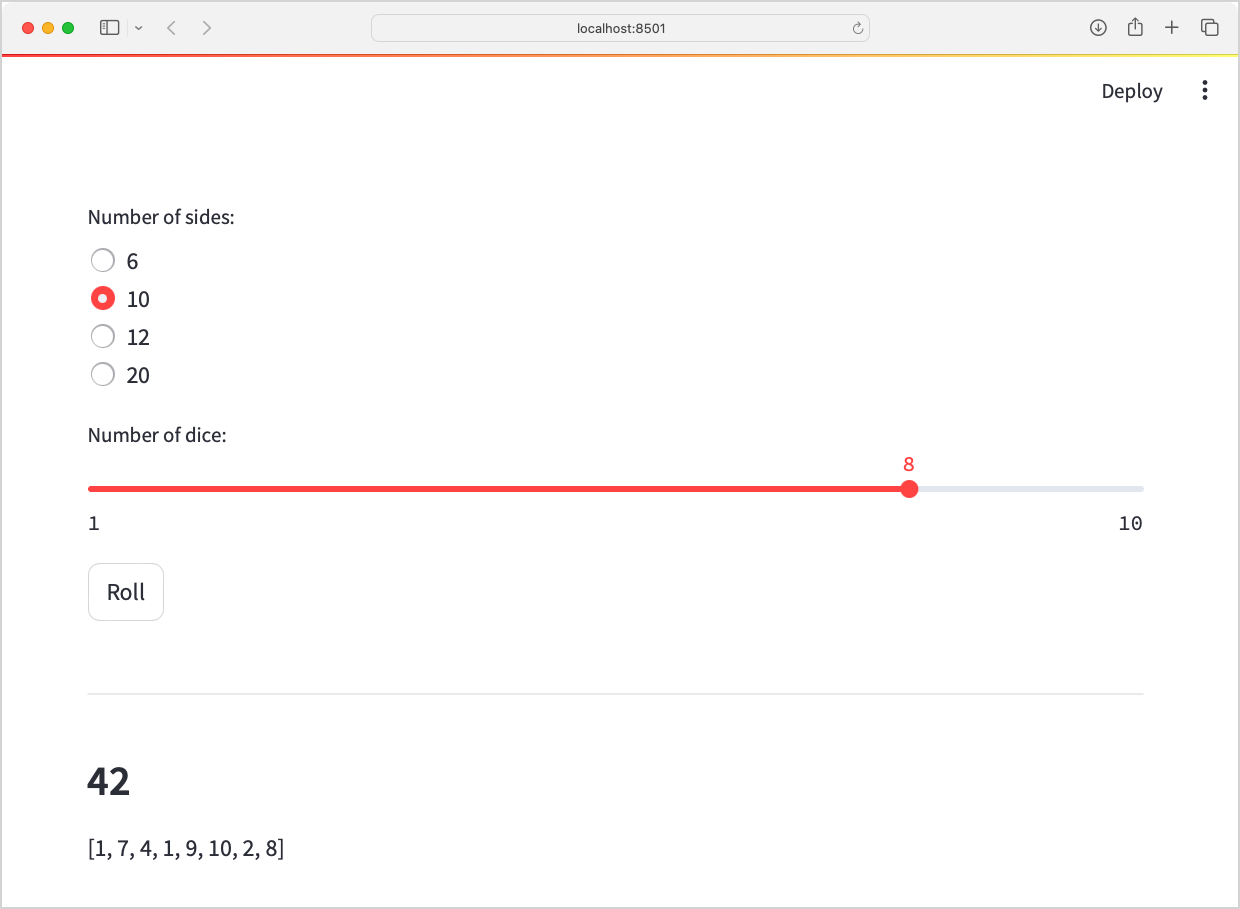
If you call st.write(rolls) without converting rolls to a string, the same information will be presented but it will take up more vertical space.
Including a chart
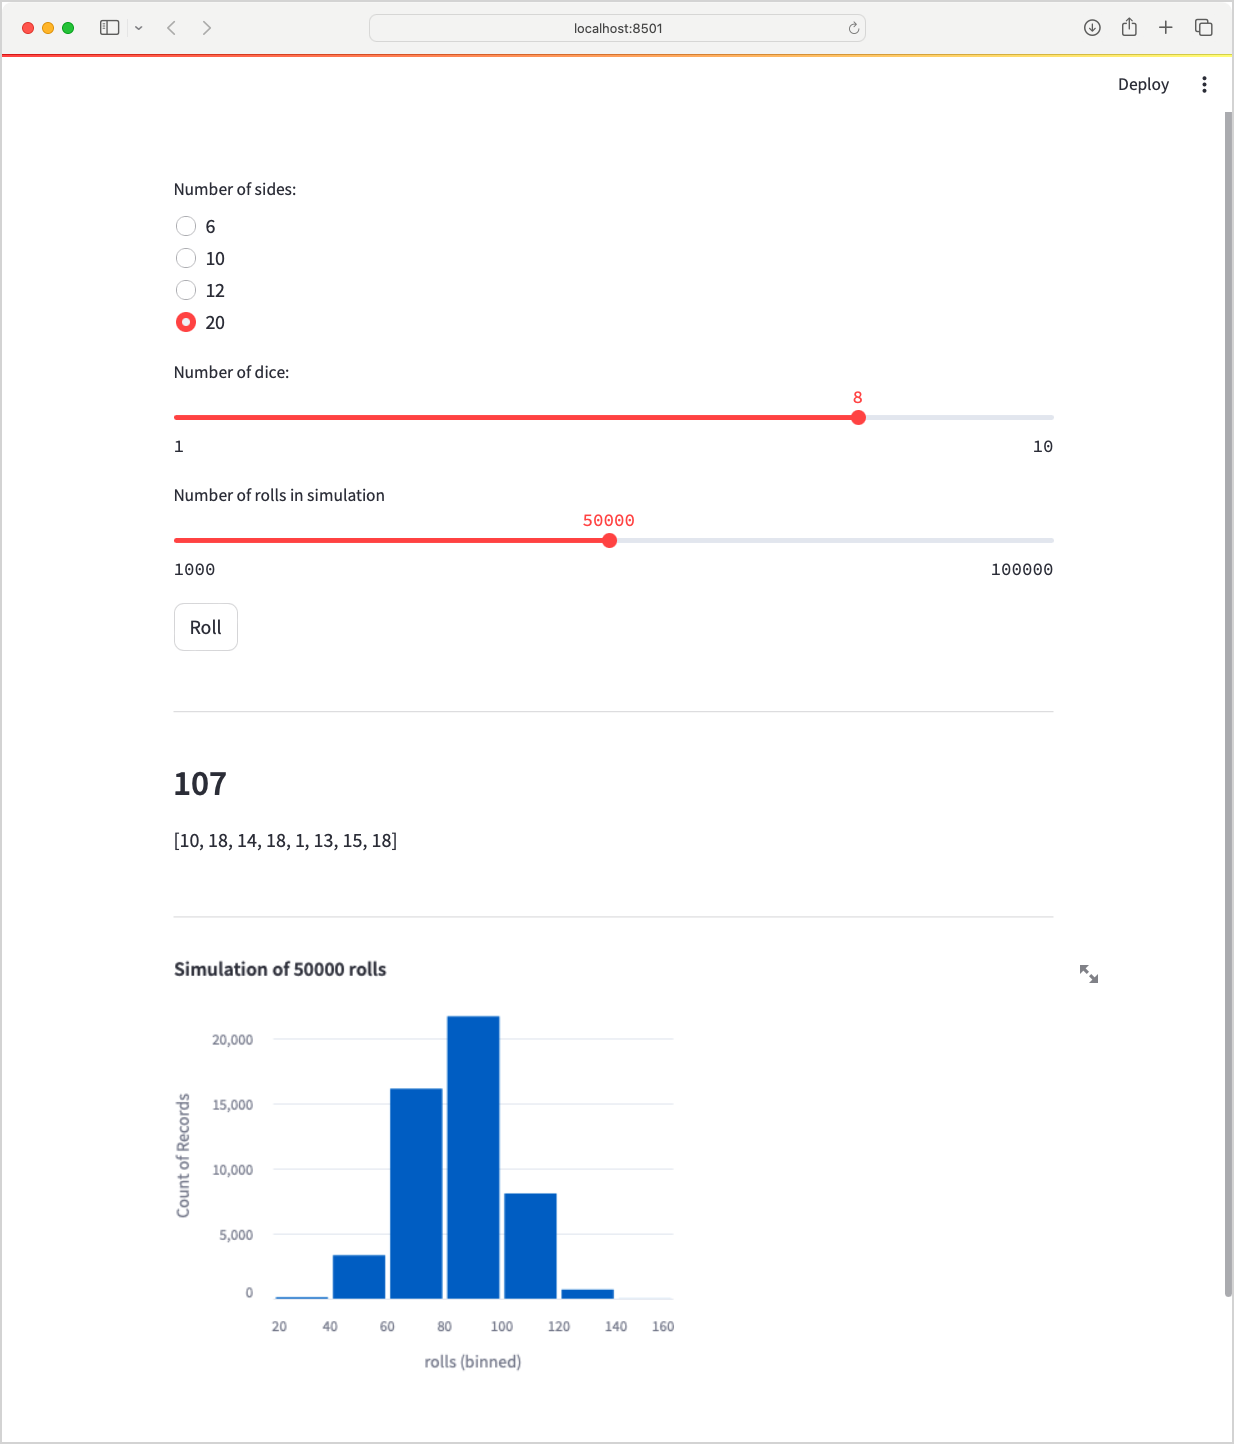
What’s a dashboard without a chart? Let’s add a chart that shows the distribution of a large number of the kind of rolls the user is making. We’ll let them choose how many rolls to include in the simulation:
from random import randint

import altair as alt
import pandas as pd
import streamlit as st


# Input widgets
side_options = [6, 10, 12, 20]
num_sides = st.radio("Number of sides:", side_options)
num_dice = st.slider("Number of dice:", 1, 10, value=2)
num_rolls_sim = st.slider("Number of rolls in simulation",
        1_000, 100_000, value=1_000, step=1_000)

st.button("Roll")

# Roll calculation
rolls = [randint(1, num_sides) for _ in range(num_dice)]
roll = sum(rolls)

# Simulation rolls
sim_rolls = []
for _ in range(num_rolls_sim):
    sim_roll = sum(
        [randint(1, num_sides) for _ in range(num_dice)])
    sim_rolls.append(sim_roll)
df_sim = pd.DataFrame({"rolls": sim_rolls})

# Create histogram
chart = alt.Chart(df_sim).mark_bar().encode(
    alt.X("rolls", bin=True),
    y="count()",
)
chart.title = f"Simulation of {num_rolls_sim} rolls"

# Output
st.write("---")
st.subheader(roll)
st.write(str(rolls))

st.write("---")
st.altair_chart(chart)
You don’t need to follow this listing closely to get the main point. We import pandas to work with a DataFrame, and we import altair to make a chart. We add a second slider that lets the user choose a number from 1,000 to 100,000, in increments of 1,000.
We make a list called sim_rolls, and generate as many rolls as the user requested. We then create a DataFrame from those rolls. This DataFrame, df_sim, is passed to alt.Chart() to create a simple histogram.
The final two lines create another section, and write the chart to the page:
Okay, that’s an interesting number of elements to have on the dashboard. Let’s take a moment to reorganize them.
Structuring the dashboard
Streamlit offers a number of ways to organize your dashboard, without having to resort to writing HTML. For one thing, we can easily stick most of the input widgets in a sidebar:
...
import streamlit as st

# Sidebar

# Input widgets.
side_options = [6, 10, 12, 20]
num_sides = st.sidebar.radio("Number of sides:", side_options)
num_dice = st.sidebar.slider("Number of dice:", 1, 10, value=2)
num_rolls_sim = st.sidebar.slider("Number of rolls in simulation",
        1_000, 100_000, value=1_000, step=1_000)

# Roll calculation.
...

# Create histogram.
...

# Main page
st.title("Rolling Dice")
st.button("Roll!")

st.write("---")
...
By simply converting st.radio() to st.sidebar.radio(), widgets can be placed in a sidebar. This is an easy way to group some elements of your dashboard off to the side, and put more focus on the elements in the main part of the page.
I also added a title to the main part of the page, and moved the Roll button just below the title. These minor changes make a much more presentable dashboard:
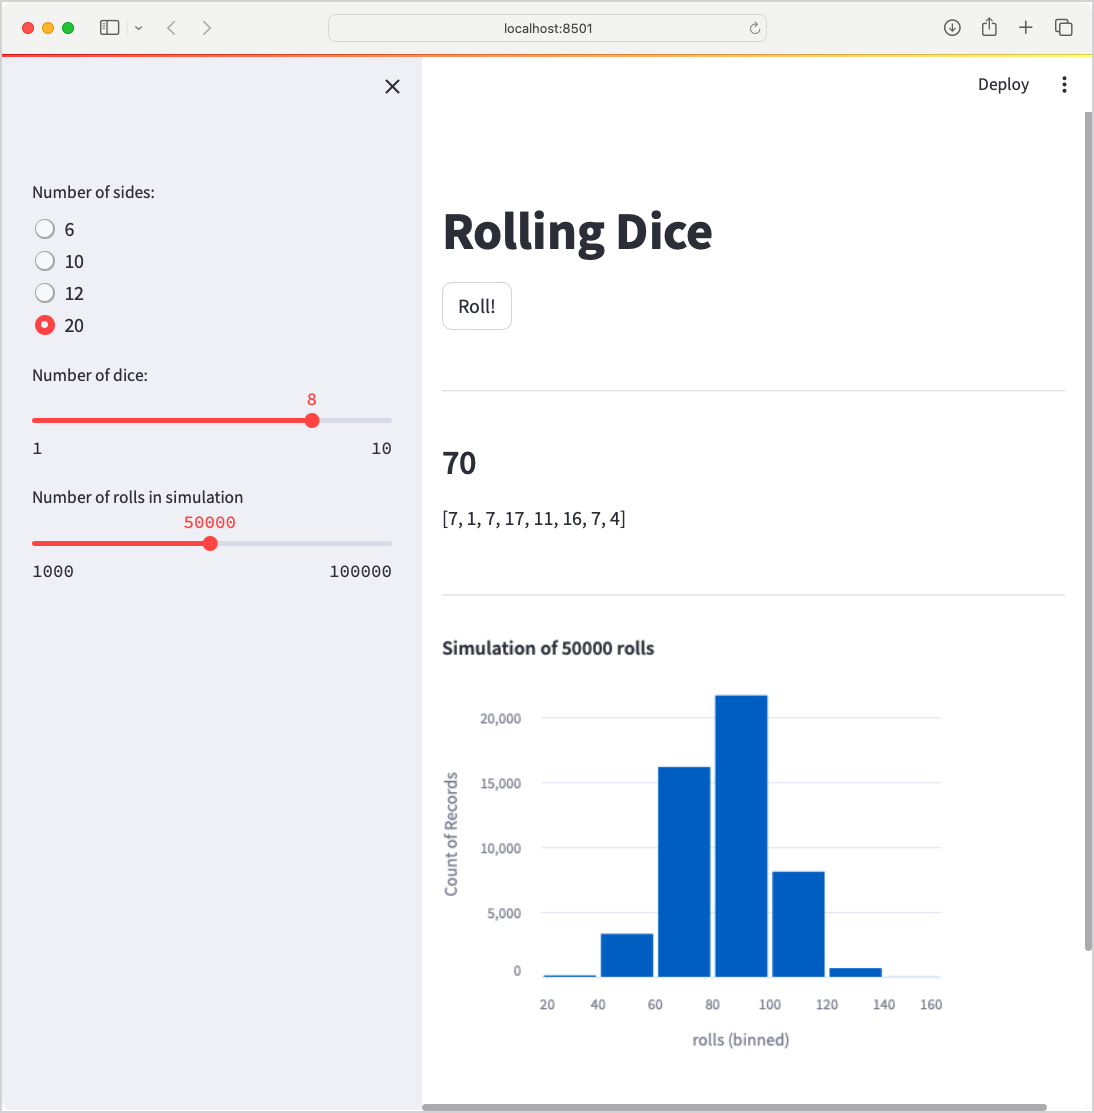
That’s a pretty nice dashboard for about 40 lines of code!
Conclusions
Streamlit is even easier to get started with than I expected. By far, most of the complexity I’ve found centers around what I’m trying to do with the data; little complexity or difficulty has come from Streamlit itself. If you’re interested in building your own dashboard, take a look at the documentation of the elements used here, and see for yourself how clearly it’s laid out:
- Documentation home page.
- st.write()
- st.button()
- st.radio()
- st.slider()
- st.altair_chart()
- st.title()
- st.sidebar()
There’s more to cover, so I’m going to write at least two followup posts. The next one will show how to deploy the dashboard we just made using Streamlit’s public hosting platform. After that, I’ll show an example of a real-world dashboard built with Streamlit.
Resources
You can find the code files from this post in the mostly_python GitHub repository.