Tracking down a bug: is it mine, or is it theirs?
MP #7: A clear, well-documented process is really helpful.
Note: The ongoing series Python Lists: a closer look will resume next Thursday. Also, public posts are open to comments from anyone. If you have any questions or feedback, please share them.
At any given time, thousands of people are working through Python Crash Course. It’s nerve-wracking when a new edition comes out, because inevitably there are going to be some errors in a 500+ page introductory book. I always cross my fingers that the errors that make it into the first printing are minor, non-breaking issues for most readers.
Once the book has been out for a while, however, it becomes an interesting bug-surfacing tool. With so many readers, someone is almost always running the book’s code on all the major operating systems, using all the recent versions of Python, and a number of versions of the libraries that the book uses. When a library gets updated in a way that affects the code in the book, I usually hear about it quickly1.
This past week I started hearing that people were running into errors when running one of the examples that uses Plotly to visualize a simulation of rolling a die 1,000 times. Rather than just sort this issue out on my own, I thought it might be interesting to document the process, for people who haven’t had to do this kind of work before. The process involves triaging, documenting, reproducing, reading release notes, reading source code, and more. The end goal is to come up with an answer the question: Whose code needs to change, mine or theirs?
“They must be wrong!”
Bug reports like these help me empathize with readers who, when starting to learn a programming language for the first time, run into an error in an early chapter. Most people assume they’ve made a mistake, and try to sort out what went wrong. Some people immediately assume that the book must be wrong, and write to me asking why the book is incorrect. (I never take offense at this. Learning to program can be frustrating, and I have no idea what pressures each reader is under to learn this material.)
When I hear the reports about sudden errors in a library, my instinctive reaction is similar: How did this famous library’s latest code end up with an error?!
Very quickly, I remember that my code may have had an issue all this time. Some bugs don’t show up until the code you depend on changes. If you’re reading a book or another resource and the steps described don’t work, be careful about that instinctive reaction They must be wrong! They may be, but you should keep an open mind until you’ve investigated the issue further.
Triage
The term triage refers to the process of assessing the validity and severity of a bug report. Is it a known issue, with a known resolution? Is it an error on the reporting person’s end, that we’ve seen other users make? Is it something new?
Even with millions of people reading Python Crash Course over the years, I’ve been able to keep my email volume reasonable by aggressively triaging reports from readers. When multiple people have found a particular section of the book confusing, I’ve revised that section so that it’s written more clearly. When there’s a breaking change with code in the book, I post an update and point everyone to that resource. I also follow up by making minor changes to the book each time it goes through a new printing.
Most potential bug reports do turn out to be errors on the reader’s part. In this case, however, the second and third reports came in fairly quickly. This indicates it’s not an error on the part of readers. In these situations, I move on to gathering a little more information and try to reproduce the bug.
Documenting and gathering information
When it’s clear that an issue isn’t just due to one reader’s mistake, the first thing I do is open an issue in a private repository. I do this work in a private repo so I can write as concisely as I need, and make any notes without concern that other people are watching over my shoulder. I briefly summarize the initial reports, and gather the information I’ll need to reproduce the bug:
What code are you trying to run? Can you share the actual .py file you’re running?
What results are you expecting to see? What results are you getting?
What OS are you using?
What version of Python are you using, and what version of the library are you using?
How did you install Python? How did you install the library?
How do you run your Python programs?
These are all questions that affect whether a given piece of code will run correctly or not. I don’t always ask people each of these questions, because usually some of this information is already clear from the initial reports.
Here’s what I learned this time:
People are trying to run the die_visual.py program, which simulates rolling a single 6-sided die 1,000 times and plots the results as a histogram.
People are getting an error message. Here’s one of the tracebacks someone sent me:
Traceback (most recent call last):
  File "C:\Users\...\main.py", line 88, in <module>
    offline.plot({'data': data, 'layout': my_layout}, filename='d6.html')
  File "C:\Users\...\venv\lib\site-packages\plotly\offline\offline.py", line 586, in plot
    pio.write_html(
  File "C:\Users\...\venv\lib\site-packages\plotly\io\_html.py", line 536, in write_html
    path.write_text(html_str)
  File "C:\Users\...\Python310\lib\pathlib.py", line 1153, in write_text
    return f.write(data)
  File "C:\Users\...\Python310\lib\encodings\cp1252.py", line 19, in encode
    return codecs.charmap_encode(input,self.errors,encoding_table)[0]
UnicodeEncodeError: 'charmap' codec can't encode character '\u25c4' in position 276398: character maps to <undefined>
Everyone I’ve heard from so far has been using Windows.
I’ve heard from people using Python 3.10 and 3.11.
Everyone I’ve heard from has been using Plotly 5.12.0.
I dump all of this information into the GitHub issue. Since it’s a private repository, I don’t need to worry much about formatting, labeling, or writing out explanations. I just dump the information, and note any initial thoughts I have at this point.
I took a quick look at Plotly’s repository for their Python library. The first thing I looked at was when their most recent release was made:
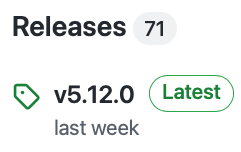
When I was first investigating this, 5.12.0 had been released three days earlier. That’s a pretty strong indication that there’s a change in the 5.12.0 release of Plotly that causes an error when die_visual.py is run on Windows. This is pretty interesting, because I haven’t seen a UnicodeEncodeError in quite a long time.
This still doesn’t mean the issue is on Plotly’s end; it’s quite possible I had gotten away with slightly incorrect code for a while, and the latest release just draws attention to an inaccuracy in the code I’ve written.
I did a little more informal digging before going to the next step in the formal process. Here’s the last part of the traceback:
UnicodeEncodeError: 'charmap' codec can't encode character '\u25c4'
    in position 276398: character maps to <undefined>
I wanted to look up that character, because I don’t remember using any special characters in the die_visual.py plot. The unicode character \u25c4 looks like this: ◄
I know there’s no character like that in the plot that die_visual.py produces, so this is getting more interesting.
Reproducing the bug
At this point my goal is to run the same file that readers are trying to run, and see if I can get the same error that they’re getting. That would prove it really isn’t a mistake on any reader’s end, and the issue is with my code, or Plotly’s code.
I use macOS as my base system, so I’ll first run die.visual.py there. I’m guessing it will work, because all of the error reports so far have come from people who are using Windows. I also know that macOS and Linux tend to handle some encoding issues differently than Windows, so it wouldn’t surprise me if this is an issue that only affects Windows users.
In the first attempt to reproduce the bug, I’ll make a virtual environment using Python 3.11, and install the latest version of Plotly, making sure it’s 5.12.0. Then I’ll copy die_visual.py into this environment, and run it. Note that you also need die.py, which contains the class that simulates a die.
The code still works for me with Python 3.11 and Plotly 5.12.0, running on macOS. Here’s the output:
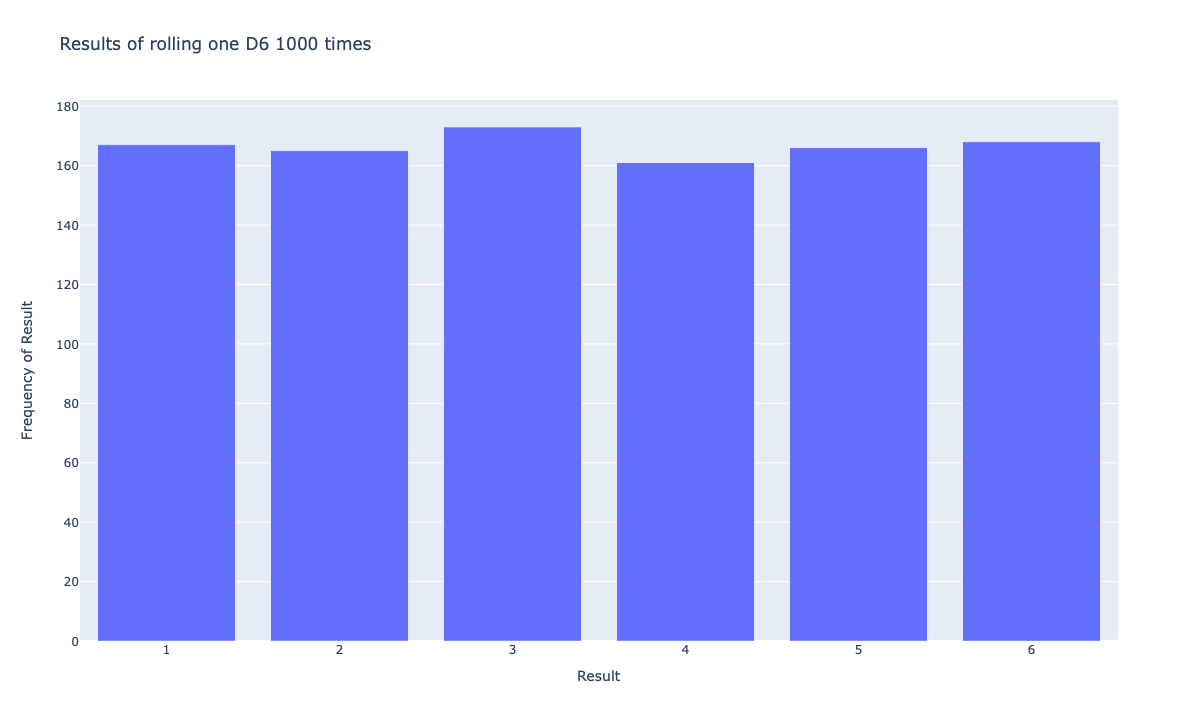
The plot looks correct, which is no surprise since the encoding issue didn’t come up. I couldn’t reproduce the bug on macOS, so I’ll run it on Windows.
One of the main reasons I use macOS is so that I can test files on all different operating systems. I use Parallels to make virtual machines emulating Windows or Linux as needed. It’s much harder, or impossible, to do that from a base Windows or Linux system. When I run this on a Windows 10 virtual machine with Python 3.11.1 and Plotly 5.12.0, I get the same UnicodeEncodeError that readers got.
That’s great! Now I can dig into what’s changed in Plotly’s code, and figure out if the fix is on my end or their end.
Minimal reproducible bug
We shouldn’t do any more troubleshooting with the die_visual.py file. That’s a mistake many people make when they ask about bugs like this on Stack Overflow, and similar help forums. It’s too hard for other people to jump into the context of this dice simulation project just to offer help. People want to work with a minimal reproducible example—the smallest, simplest piece of code we can write that recreates this issue.
To make a minimal reproducible example, let’s look more carefully at the traceback. I’ve broken the traceback into sections, and bolded the parts that are most informative in tracking down this issue:
Traceback (most recent call last):
  File "C:\Users\...\main.py", line 88, in <module>
    offline.plot({'data': data, 'layout': my_layout}, filename='d6.html')
In the file main.py, there’s a line that calls offline.plot(). I asked the person who shared this traceback about this file, and they said they had renamed die_visual.py in their attempt to resolve the issue. That might have been important at one point, but since I’ve already reproduced the error it doesn’t matter anymore. The line of code shown here comes directly from an example in Python Crash Course; it’s part of die_visual.py.
Now the traceback moves into Plotly code:
File "C:\Users\...\venv\lib\site-packages\plotly\offline\offline.py", line 586, in plot
    pio.write_html(
  File "C:\Users\...\venv\lib\site-packages\plotly\io\_html.py", line 536, in write_html
    path.write_text(html_str)
  File "C:\Users\...\Python310\lib\pathlib.py", line 1153, in write_text
    return f.write(data)
This is all code that deals with writing a plot as an HTML file. It’s a call to a method or function called write_html(), a call to write_text() with an HTML string as an argument, and finally a call to write some data to a file.
Okay, so the issue happens when trying to write an HTML file. Let’s look at the last part of the traceback:
  File "C:\Users\...\Python310\lib\encodings\cp1252.py", line 19, in encode
    return codecs.charmap_encode(input,self.errors,encoding_table)[0]
UnicodeEncodeError: 'charmap' codec can't encode character '\u25c4'
    in position 276398: character maps to <undefined>
To be honest, I’m not entirely sure what’s going on here. However, I notice that this is a Python 3.10 library file that deals with encodings. It’s working with something called an encoding_table. It can’t encode a unicode character that’s not used anywhere in the plot, to the best of my knowledge.
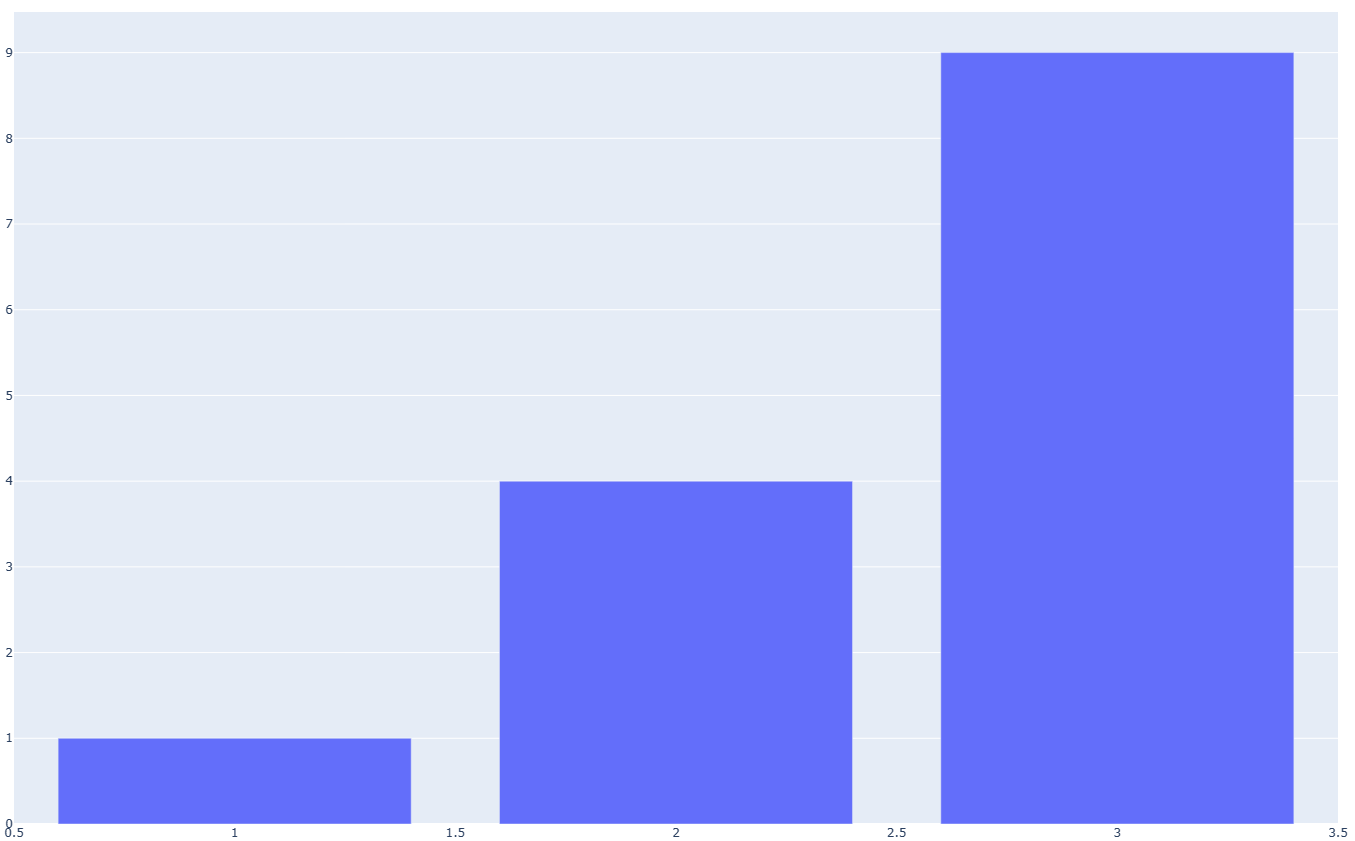
So, what happens if we write a really simple plot, like a bar chart with a single bar? I’ll make this example on my macOS system. Since I’m working on both OSes right now, I might as well make a small example that works on macOS, and doesn’t on Windows.
Here’s what I came up with:
# minimal_example.py

from plotly.graph_objs import Bar
from plotly import offline

data = [Bar(x=[1, 2, 3], y=[1, 4, 9])]
offline.plot({'data': data}, filename='minimal_example.html')
I stripped away all the code that dealt with dice, and anything that dealt with styling. The plot has three bars, but they’re defined in one line of code. This is actually a perfect example of a minimum reproducible example, assuming it reproduces the error on Windows. It’s just four lines of code; it’s easy for anyone to copy and run, and then they can dig into the main issue that causes the error.
Here’s the output on macOS:
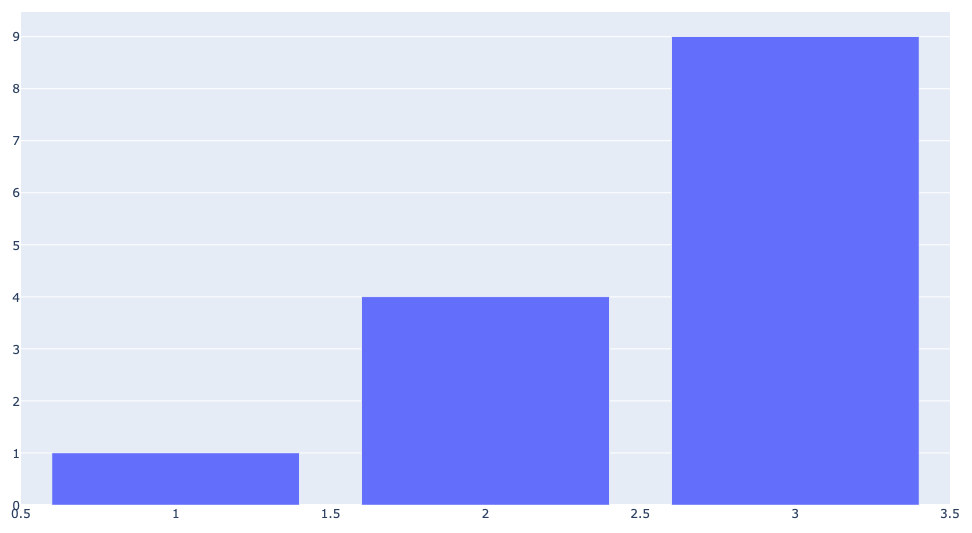
When run on Windows, this does in fact produce the same error.
Looking at release notes
Next, let’s look at the release notes for Plotly 5.12.0 and see if there’s anything obvious in that announcement. Release notes can come in a variety of formats. Plotly has a CHANGELOG.md file in their repository, so let’s start there.
This is a quick read; there’s a small set of changes, and nothing jumps out at me as being obviously related to this bug. Often times, however, there’s a specific note in a changelog that is clearly related to the issue you’re seeing. It’s well worth looking at the changelog when a new version of a library seems to cause a bug.
Finding the last working release
We want to know exactly what changed on Plotly’s end to make this code break, so we need to know the most recent version where the minimal example runs without errors on Windows. We’ll look at the list of recent releases, and step backwards through them. For each release, we’ll downgrade the version that’s installed in the virtual environment on Windows, until the minimal example runs.
The changelog is helpful again here. We can see that the last version before 5.12.0 was 5.11.0. In the virtual environment, installing this version can be done in one line:
> pip install plotly==5.11.0When you specify an exact version like this in an environment where the library is already installed, pip will uninstall the old version and install the newly specified version. Note that I’m doing this on Windows, not on macOS.
After this change, the minimal example works on Windows. Incidentally, die_visual.py works as well. That’s no surprise, but it’s worth checking at this point since the file is already in the same environment as the minimal example.
Now we know something changed between 5.11.0 and 5.12.0 to cause the minimal example to stop working. Let’s see if we can find that code.
Looking at recent commits
Let’s start by looking at what changed between 5.11.0 and 5.12.0. There are a number of ways to see what’s changed between versions: for example you can look at pull requests, and you can look at overall commits to a repository. Which is better can depend on how commits are handled in a project. Some projects squash commits, and there are a relatively small number of commits to look through between versions. Some projects leave a large number of individual commits in their Git history.
In this case, since I don’t know Plotly’s approach, I’m just going to look at recent commits. At the top of a GitHub repository, you’ll see this information:
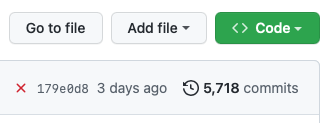
This tells us how many commits have been made to the project. If you click on the number of commits, you can begin to scroll through the entire commit history of the project. The bug we’re working on was recent, so maybe we’ll spot something relevant in one of the recent commits.
This is pretty amusing to run into while writing up a post about fixing a bug:
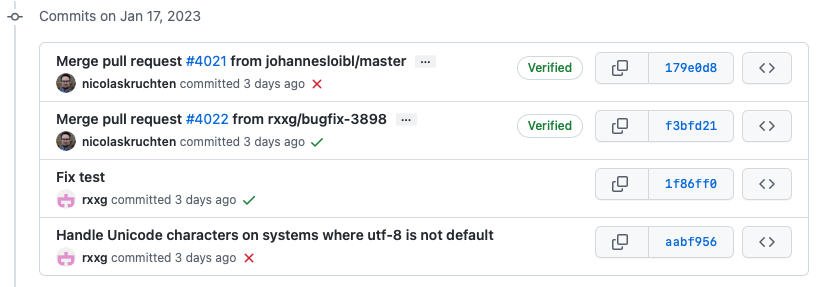
It looks like three days ago, as of this writing, someone worked on this same bug: Handle Unicode characters on systems where utf-8 is not default. That’s great! They did our work for us! This is not unusual to find. In popular libraries, breaking changes that make it into a release are often found quickly, and small issues tend to be fixed quickly. It can, however, take a little while for the fix to make it into a new release.
I’m going to handle this a little differently than normal, to finish this post in a way that’s still helpful to people who want to see the whole process of finding and fixing a bug play out. Normally at this point I’d test the latest code, and tell readers how to install the updated version.
In the context of writing this post, I’ll run this code to see if it addresses the bug we’re working on. However, I won’t peek at the fix yet. We’ll see if we find the same fix that this contributor did.
Testing the current development branch
Let’s install the latest development version and see if the bug goes away. You can install the current state of a project directly from a GitHub repository.
Well, that approach didn’t work out. Normally, you can run a command like this:2
$ pip install git+https://github.com/plotly/plotly.pyThis command usually installs the latest committed version of the main branch of the repository. However, since Plotly is a more complex project that depends on some JavaScript libraries, there’s a more complex series of steps needed to install the latest development version.
Instead of installing Plotly in this way, I’m going to try a shortcut. I’m going to install Plotly 5.12.0 again, and see if I can modify Plotly’s Python code inside my virtual environment, in a way that fixes the bug.
Attempting a fix
To start working on a fix, I’ve reinstalled Plotly in the Windows virtual environment with the command:
> pip install plotly==5.12.0Now I’m going to run the minimal example again, so I can get a traceback that accurately reports where the issues are in this particular installation.
What I’m looking for is the last file in this traceback that belongs to Plotly. Here’s the part of the traceback that shows that information:
...
  File "C:\Users\eric\Desktop\plotly_test\.venv\Lib\site-packages\plotly\io\_html.py", line 536, in write_html
    path.write_text(html_str)
...
We need to start with the file _html.py, whose full path is shown in bold above.
When you install a package in a virtual environment, by default it’s installed into the site-packages directory. We’ll open the file _html.py, and look at line 536.
This line is part of a function that’s almost 200 lines long. Here’s the function definition, and the block of code that line 536 is part of:
def write_html(
    ...
):
    ...
    # Write HTML string
    if path is not None:
        path.write_text(html_str)
    else:
        file.write(html_str)
Okay, this is roughly what I expected to see. The function has built up a string with HTML code in it, and it’s trying to write that string to an HTML file. I’m guessing that write_text() should have an encoding argument, probably encoding="utf-8". But it might not be that simple; it might need a check about what operating system the code is running on.
I’m going to add the encoding argument and see if the minimal example runs. Here’s my modified code:
    # Write HTML string
    if path is not None:
        path.write_text(html_str, encoding="utf-8")
    else:
        file.write(html_str)
And here’s the result:
Success! There’s still some work left to do, but now we have enough information to open a really helpful issue in the Plotly repository, and we could do some more work to submit a pull request if we wanted to. I ran die_visual.py at this point, and it works as well, as we’d expect.
Let’s look at the changes between 5.11.0 and 5.12.0, and see if we can spot the point where the encoding argument became an issue. Was it there before and it recently got removed? Is there something else going on?
Looking at a file’s history
Instead of looking at the entire history of the plotly.py repository, let’s look at just the history of _html.py. We’ll probably spot the breaking change in there.
We navigate to the _html.py file in the GitHub repository, and click history. Here’s what we see:
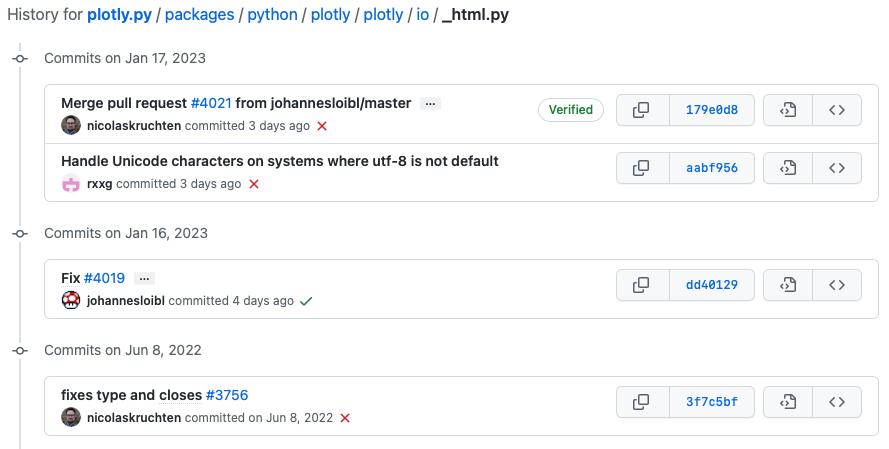
There were some recent changes, that were probably associated with fixing this bug. Before that, the last activity in this file was from June 8, 2022. I’m going to start by looking at the file as it stood at that point.
Looking at the _html.py file from that date, I don’t actually see anything that helps right away:
    # Write HTML string
    if path is not None:
        path.write_text(html_str)
    else:
        file.write(html_str)
This is the code that’s in the 5.11.0 version of Plotly, and there’s nothing here about encoding. At this moment, I’m not sure why this 5.11.0 code works on Windows, but the 5.12.0 version doesn’t.
Accepting others’ help
At this point I have no real interest in fixing this on my own. I’m ready to look at the more recent commits, see what’s changed, and see what people are saying about it. If no one had come forward about this bug, I’d poke around a little more. For example I’d look at the full set of changes across the 5.11.0 - 5.12.0 transition, and see if I could spot anything.
If nothing stood out to me, I’d open an issue. We already have plenty of specific information to share with maintainers. I’d share the 5-line minimal reproducible example, and state that it works on 5.11.0 on Windows but fails on 5.12.0. I’d share the one-line change that makes the bug go away, but say that I’m also aware I haven’t run Plotly’s full test suite, and I have no idea how that change affects the way Plotly runs on other operating systems.
This is a perfectly reasonable time to stop and open an issue, even if we could do more work on our own. When maintainers get a detailed issue like this, they can often point right to another place in the codebase that’s related to the issue, that may not be obvious at all to people who are unfamiliar with the codebase. If the maintainers say they’re too busy to look into it, or that they have no idea where to look, then it’s reasonable to spend more time on your own.
So let’s look at the most recent commits. Here are the highlights of walking through the work people have done to address this bug:
This is related to a change in a JavaScript library that explicitly encodes files as utf-8. Here’s a recent issue that discusses this change.
Here’s a change in _html.py that relates to that JavaScript update. Notice this is almost identical to the change we made; it’s just making the encoding explicit.
Here’s the change to the section of _html.py that we were looking at. This is identical to the change we made, except it’s using a positional argument instead of a keyword argument:
    # Write HTML string
    if path is not None:
        # To use a different file encoding, pass a file descriptor
        path.write_text(html_str, "utf-8")
    else:
        file.write(html_str)
Finally, note the message at the end of the JavaScript issue that this fix will be pushed out in 5.12.1, which is just waiting on another fix in a package that Plotly depends on. The maintainers expect the fix to be out in the next week or so.
Conclusions
This is a pretty accurate demonstration of the work that goes into tracking down an issue related to a new release of a library that a project depends on. Once you know the process, it can go pretty quickly. If I’m not stressed about other work, I usually find the process fairly enjoyable. It’s always interesting to see the internal workings of a library that I’ve used for a while but haven’t poked around in. It’s really satisfying to come up with a fix, and even if someone else submits the fix first it’s a nice bit of validation that I’m a competent programmer.
I don’t think I would have found the related JavaScript issue quickly, just because I don’t know that ecosystem very well at the moment. But that’s the whole point of open source; we work together so that we don’t all have to know everything.
I probably won’t do much with this fix other than telling anyone who reaches out over the next few days to downgrade Plotly to 5.11.0 until 5.12.1 is out, and I’ll share that same information with the people who’ve already reached out.
I hope this helps, and if you have any questions I’m happy to respond in the comments.
Update: Plotly just released version 5.13.0, which fixes this issue.
Resources
You can find the code files from this post in the mostly_python GitHub repository.
I’m actually fairly proactive about this. I read the release notes regularly for the major libraries that the book depends on, and test a lot of the book’s code against early releases of new library versions. If I find an issue on my end, I try to get an update made to the book before it goes to print again. Each edition of the book goes through about ten printings; the last printing of each edition ends up being somewhat different than the first printing of that edition. ↩
Note that the plotly.py you see in the repository address https://github.com/plotly/plotly.py is not a .py file. Rather, it’s the name of Plotly’s Python repository. ↩