Profiling a uv-based project

MP 167: It's not quite as straightforward as profiling a single-file program.
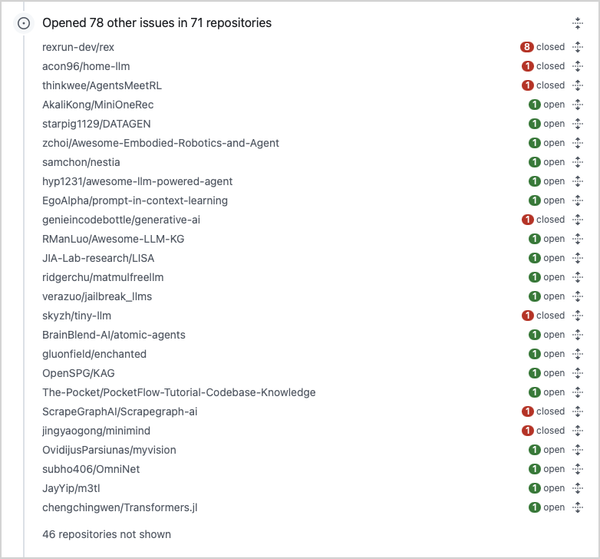
Over the past couple weeks, I've been continuing to work on gh-profiler. If you missed the last post, gh-profiler gives you a quick summary of a GitHub user's profile and recent activity. The goal is to highlight any indications the user might be using AI in a way that puts an excessive burden on open source maintainers. These signals can help maintainers decide how much time to invest in someone who opens a new issue or PR on their project for the first time.
I like what this project does, but it's also been a great opportunity to dive into the full uv-based workflow. This is my first real-world project where I've used uv's project-based workflow for everything it can handle.
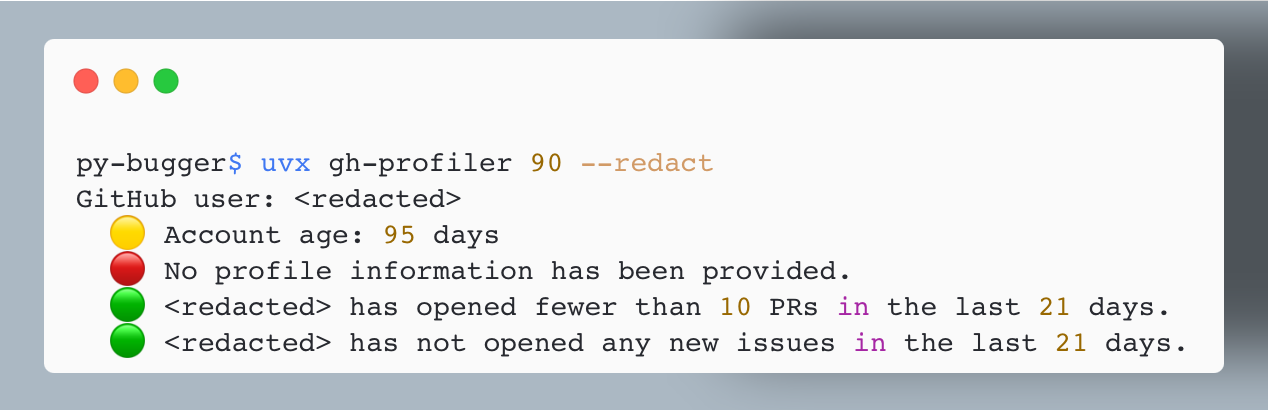
gh-profiler with an issue or PR number. It finds the user who opened the issue/ PR, and generates a summary of the user's profile and recent activity. This user has a newer GH account, and they haven't provided any profile information at all. That's helpful to know when deciding how much to engage with them.All that uv offers
I started the project with uv init, and added dependencies with uv add and uv add --dev. I'm pinning dependencies with uv lock. During development, I'm running the project with uv run. When it was time to package the project and publish it on PyPI, I used the uv build and uv publish commands.
This has been an amazingly simple and unified workflow! It's really nice to use one tool for all these aspects of managing a modern Python project. It's been a bit odd to not manage my own virtual environment, but it's also quite freeing. When working on this project, I only think about virtual environments when I see behavior I don't expect, like a breakpoint that isn't being hit. I keep thinking uv must be running a different version of the project than I think it is, only to realize I have some branching logic in my project that I forgot about. I'm the reason that breakpoint was missed, not uv!
uv really is much more powerful than just a faster replacement for pip. If you have a new project coming up, consider using uv for the entire workflow and see if it meets all your needs. If you're curious to try this, see Working on projects in the uv docs.
Running the project in a variety of ways
I'm using uv for everything on this project, but many users are not. So I want to support all the following ways to invoke gh-profiler:
$ uv run gh-profiler ...

$ uvx gh-profiler ...

$ pip install gh-profiler
$ gh-profiler ...
$ python -m gh_profiler ...
Here's the project structure that supports this:
gh_profiler$ tree -L 3
├── pyproject.toml
├── src
│   └── gh_profiler
│       ├── __init__.py
│       ├── __main__.py
│       ├── cli.py
│       └── gh_profiler.py
| ...
The highlighted files all help manage the project's entry points. For example, here's an excerpt from pyproject.toml:
[project.scripts]
gh-profiler = "gh_profiler.cli:main"
This says that when gh-profiler is invoked, it should look in the gh_profiler/ directory, find a file called cli.py, and run that file's main() function.
If you've installed gh-profiler to a virtual environment, you can run the project as a module:
(.venv)$ python -m gh_profiler --help
Usage: gh-profiler [OPTIONS] TARGET

  Examine a GitHub user's profile, to help quickly decide how much to invest
  in their contributions.
  ...
When you run gh-profiler as a module, it looks to __main__.py for its entry point:
"""Allow project to run as a module."""

from .cli import main

if __name__ == "__main__":
    main()
This is another way to tell Python to look for the cli.py file, and run its main() function.
Performance
I was making steady progress on gh-profiler, but it was starting to slow down as it processed more information about the user. It was checking that the GitHub CLI tool was installed and authenticated, and then making a number of calls to get information about the user's profile, recent PR activity, and recent issue activity.
When you're focusing on performance, there are two measurements you should take before modifying any code. You should measure how long it takes the overall project to run, so you know whether the work you're doing will save your users a meaningful amount of time. Then you should profile your code, so you know where the actual bottlenecks are.
Measuring overall run time
uv makes it quite easy to check how a project's performance has changed over multiple versions:
$ time uvx gh-profiler@0.1.0 ehmatthes
  ... 2.504 total
$ time uvx gh-profiler@0.2.0 ehmatthes
  ... 2.536 total
$ time uvx gh-profiler@0.3.0 ehmatthes
  ... 3.520 total
You have to run these commands a few times to make sure you're not including the time it takes uv to install specific versions, and that a specific run isn't being impacted by a slow API response.
Here the 0.3.0 release is a full second slower than earlier releases. Run time has gone from about 2.5 seconds to 3.5 seconds, when run against my GitHub profile. The 0.3.0 release started examining the user's recent activity involving issues, which requires another call to GitHub's API.
I think I can decrease the overall execution time by reducing the number of API calls. But first, let's do some profiling.
Running cProfile
cProfile is Python's built-in profiling tool. Here's my original writeup of cProfile, which I still refer back to when I haven't done any profiling in a while.
When you have a Python program that consists of a single .py file, profiling is easy:
$ python -m cProfile -s cumtime main.py
This profiles a run of the file main.py, and sorts the resulting output by its cumulative time.
For gh-profiler, with its more involved project structure, it wasn't clear to me how to run cProfile at first. Here's one of my failed attempts:
$ uv run python -m cProfile -s cumtime src/gh_profiler/cli.py ehmatthes
         9482 function calls (9303 primitive calls) in 0.009 seconds

   Ordered by: cumulative time

   ncalls  tottime  percall  cumtime  percall filename:lineno(function)
     20/1    0.000    0.000    0.009    0.009 {built-in method builtins.exec}
        1    0.000    0.000    0.009    0.009 cli.py:1(<module>)
        ...
Traceback (most recent call last):
  ...
  File "src/gh_profiler/cli.py", line 5, in <module>
    from . import gh_profiler
ImportError: attempted relative import with no known parent package
I was trying to have cProfile run a .py file directly, as I'd usually done in the past. It wasn't working, because that's not how this project is set up to run. Import errors like this are never fun to sort out.
The correct approach was to have cProfile run gh_profiler as a module, just as an end user would:
$ uv run python -m cProfile -s cumtime -m gh_profiler ehmatthes
The key thing that helped me get here was recognizing this progression:
# With uv:
$ uv run gh-profiler ehmatthes

# With Python:
$ python -m gh_profiler ehmatthes

# With uv calling Python:
$ uv run python -m gh_profiler ehmatthes

# With uv calling cProfile
$ uv run python -m cProfile -m gh_profiler ehmatthes

# With the `-s cumtime` arg:
$ uv run python -m cProfile -s cumtime -m gh_profiler ehmatthes
There's a lot to understand here if you're not already knee-deep in Python packaging! A lot of this comes down to recognizing the different tools that can run a Python project, and the different ways that process can be handled. The final call here has uv run Python, which runs the cProfile module against the gh_profiler module.
Improving performance
There's one more addition to the profiling command I like to use. For real world projects, cProfile often has more output than you can easily work with in a terminal window. I like to dump the output to a text file, which I can then search more easily:
$ uv run python -m cProfile -s cumtime -m gh_profiler ehmatthes > profile.txt
After running this and looking through the results, here are the most important measurements:
ncalls  tottime  percall  cumtime  percall filename:lineno(function)
    1    0.000    0.000    2.013    2.013 profile_utils.py:53(get_pr_activity)
    1    0.000    0.000    0.624    0.624 profile_utils.py:75(get_issue_activity)
    1    0.000    0.000    0.337    0.337 profile_utils.py:15(ensure_gh)
1 0.000 0.000 0.296 0.296 profile_utils.py:36(get_profile_info)The project was spending about 2 seconds getting the user's recent PR activity. It was spending just over half a second getting their recent issue activity. It was spending about a third of a second checking that the gh CLI was installed and authenticated, and another third of a second getting their profile information.
I did two things to improve performance:
- In
get_pr_activity(), there were three calls to get the number of recently opened PRs, recently merged PRs, and recently closed PRs. I updated this function to make one call to get all recent PR activity, and then calculate the more specific counts locally. - In
ensure_gh(), I removed the API call that checks whether the gh-profiler user is authenticated. Instead, we just examine the output of the first API call that fetches data that we actually need.
Here's what profiling looks like for those four functions after these changes:
ncalls  tottime  percall  cumtime  percall filename:lineno(function)
    1    0.000    0.000    0.618    0.618 profile_utils.py:62(_get_pr_activity)
    1    0.000    0.000    0.612    0.612 profile_utils.py:87(_get_issue_activity)
    1    0.000    0.000    0.270    0.270 profile_utils.py:39(_get_profile_info)
1 0.000 0.000 0.023 0.023 profile_utils.py:14(ensure_gh)The call to get PR activity has dropped from 2 seconds to just over half a second. The call to ensure that gh is available is down to two hundredths of a second, because we're only making a local call now.
Before celebrating too much, let's go back to the overall runtime:
$ time uvx gh-profiler@0.3.3 ehmatthes
  ... 1.610 total
gh-profiler 0.3.3 is the first version that included these changes, and at 1.6 seconds it's running faster than any previous version, even the earliest versions that didn't examine the user's issue activity. Before these changes, this call took about 3.5 seconds. That's a good start on improving performance!
Conclusions
It's been quite satisfying to use uv for managing all aspects of a modern Python project. That said, it does require some different usage patterns, and it takes a while to understand how everything's being managed. But I didn't understand virtual environments overnight, so I don't expect to learn a new project structure overnight either. I sure hope uv continues to be developed and maintained well.
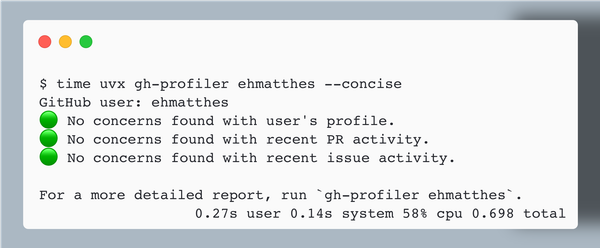
I'm going to add support for a --concise flag for gh-profiler, which will show just four lines of output. Once that's implemented, I'm going to see if I can set up a GitHub action that will write this output to a comment on every new issue and PR that's opened in the gh-profiler repository. I think it would be pretty interesting to make this information visible in an open source project.