Batching API calls

MP 168: An obvious speedup, with a surprising side benefit.
I've been working steadily on gh-profiler, while attending PyCon US and working on other projects as well. The project makes a number of calls to GitHub's API, and then analyzes the results to generate some indicators of whether the targeted user has been engaging in problematic open source behavior.
These calls were being made serially, so one of the obvious low-hanging optimizations was to try parallelizing the API calls. This had the expected effect; most gh-profiler runs were significantly faster after running them in parallel. But it also had a much more significant effect: it means any additional call we want to make to gather more information about the user's activity is pretty much free. If that new call is faster than the current slowest API call, it shouldn't affect the overall execution time noticeably at all.
In this post I'll show what kinds of changes were necessary in order to make parallel API calls, and discuss the unexpected benefits of making this change.
The old (serial) way
When I started this project I wasn't sure how much information I'd need to get about the user in order to start producing a meaningful signal. So I just started making API calls, and then analyzing the results of each call.
The first thing I wanted to look at was how old the user's account was, because newer accounts can be a sign the user is a bot that's spamming open source issues and PRs. An early version of gh-profiler looked something like this:
ensure_gh()
ensure_authenticated()

check_account_age()
The first two steps make sure the GitHub CLI tool gh is installed, and that the user is running an authenticated session of gh. Then a call is made to get information about the new contributor's account, and that information is processed.
The output looked like this:
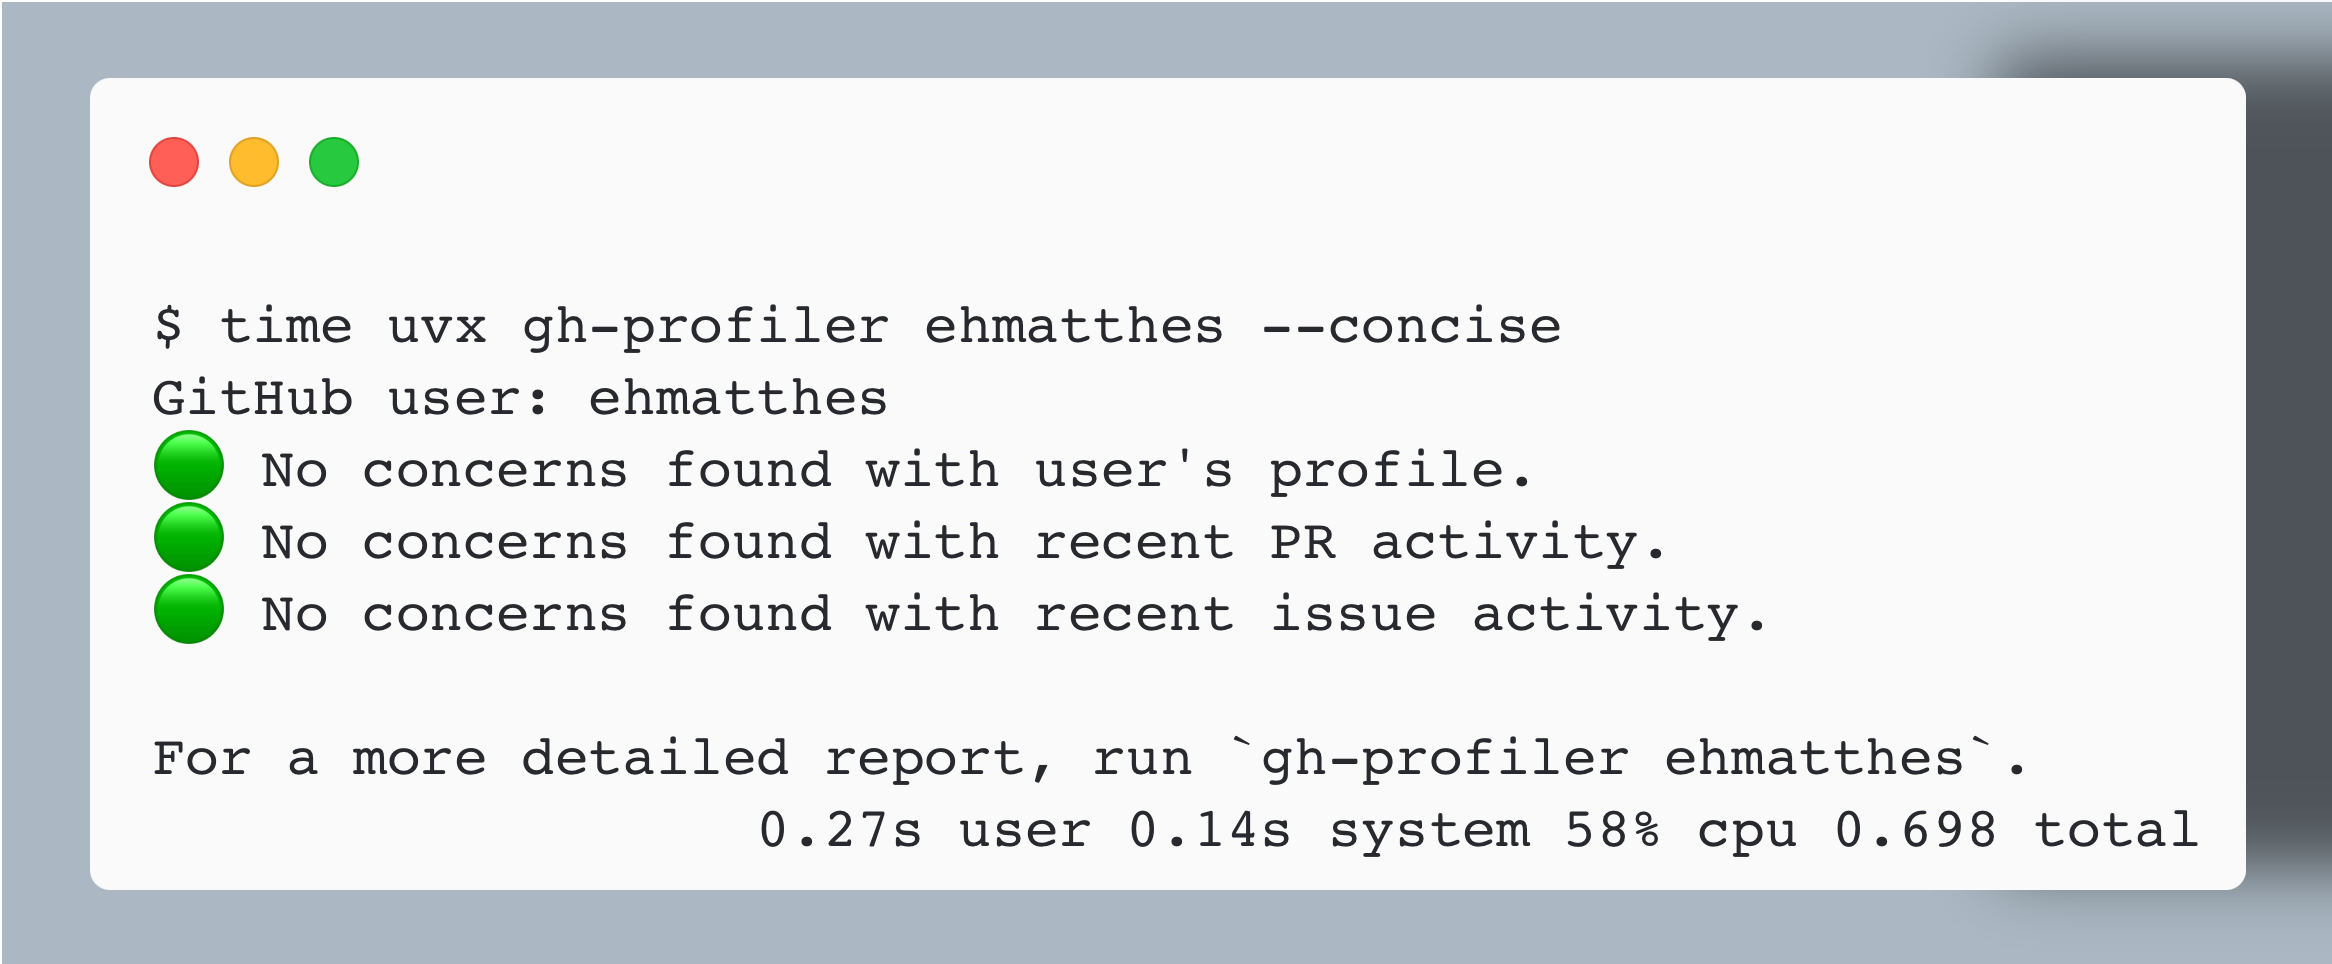
$ uvx gh-profiler ehmatthes
GitHub user: ehmatthes
🟢 Account age: 13 years
This was a good start. But I ended up grabbing a bit more information before building out the first useful version of gh-profiler. The core of the project expanded piece by piece until it looked more like this:
ensure_gh()
ensure_authenticated()

check_account_age()
check_profile_info()

check_pr_activity()

check_issue_activity()
That was enough information to get meaningful signals about whether a user was likely to be a well-intentioned human contributor, a bot, or a human using AI to spam a bunch of repos:
$ uvx gh-profiler <redacted>
GitHub user: <redacted>
🟡 Some concerns found with user's profile.
   🟡 Account age: 6 months
   🟢 Profile information:
        ...

🟢 No concerns found with recent PR activity.
   🟢 Fewer than 10 PRs opened in the last 21 days.

🔴 Significant concerns found with recent issue activity.
   🔴 79 new issues opened in the last 21 days.
   🟢 1 issues closed as NOT_PLANNED.
   🔴 71 issues opened with the same title:
        📋 Documentation Enhancement Suggestion (71)
This was quite useful! But there were some problems with the approach I had started with.
Growing pains
There were a number of problems that were clear at this point, as the project was starting to see some actual usage:
- It was getting slower with each new piece of information that was being included.
- People were starting to identify additional patterns of behavior that we should check for. But every new API call would mean the program takes longer and longer to run.
In the last post, I described addressing this by getting rid of the ensure_authenticated() call, and checking the results of the first necessary API call to see if it was successful instead. That turned out to be unreliable, in part because there are several ways a user can be unauthenticated. For example, the user may have logged out explicitly, or they may have an expired token.
It turns out an explicit check for whether the user is authenticated was quite useful after all. But, adding that call back in would slow the program down by ~0.3 seconds. That's not much, but it was a trend I didn't want to resume.
Re-architecting for parallel calls
To parallelize the API calls, I needed to restructure the project so that fetching necessary data was separate from processing the data. Before introducing any parallel code, I restructured the project to look like this:
ensure_gh()

def get_data():
    fetch_status()
    fetch_age()
    fetch_profile_data()
    fetch_pr_data()
    fetch_issue_data()

def process_data():
    process_status()
    process_age()
    ...
The function to check whether gh is installed is entirely local, so it's quick and can be run before anything else. All external data is first fetched by get_data(), and then all the fetched data is processed by process_data().
There was no change in the project's behavior. It just did all the fetching first, and all the processing second. Here's the full main() function from gh_profiler.py:
def main():
    # Generate new workflow, if that's what was requested.
    if pdata.generate_workflow:
        workflow_utils.generate_workflow()
        sys.exit()

    # Make sure gh is available.
    profile_utils.ensure_gh()

    # Get and analyze all data we'll need from GitHub.
    profile_utils.get_data()
    analysis_utils.process_data()

    # Summarize findings.
    summary_utils.show_summary()
Profiling showed that the fetching took several seconds, but the processing was almost instantaneous:
0.024 profile_utils.py:16(ensure_gh)
1.670 profile_utils.py:31(get_data)
0.000 analysis_utils.py:11(process_data)
0.000 summary_utils.py:8(show_summary)
Checking locally that gh installed takes about a tenth of a second. Grabbing the data for my profile takes about 1.6 seconds. Processing the data and generating a summary take less than a thousandth of a second.
Implementing a parallel approach
Now that fetching data is separate from processing data, we can batch the fetching calls into a pool of concurrent calls. ThreadPoolExecutor is well-suited for this kind of work.
Here's what the parallel version of get_data() function looks like:
from concurrent.futures import ThreadPoolExecutor
...

def get_data():
    """Get all data we'll need from GitHub."""
    with ThreadPoolExecutor() as executor:
        # Make fetching calls.
        status_future = executor.submit(_fetch_status)
        profile_dict_future = executor.submit(_fetch_profile_dict)
        ...

        # When each call finishes, store the result.
        status_str = status_future.result()
        profile_dict_str = profile_dict_future.result()
        ...

    # Parse data. This should only happen after all data has been fetched.
    _parse_status(status_str)
    _parse_profile_dict(profile_dict_str)
    ...
This might look complicated if you haven't worked with parallel code before. There are a few things to notice.
First, ThreadPoolExecutor is used in a context manager (with):
with ThreadPoolExecutor() as executor:
This line creates an executor that can manage a pool of threads. We're going to submit a series of fetching calls to be handled by the executor, which will run those calls concurrently.
Within this block, we call executor.submit() for each task we want to run:
status_future = executor.submit(_fetch_status)
This line says to submit the _fetch_status() call to the executor. The submit() method returns an instance of Future, which we assign to status_future. This object will store the result of the _fetch_status() call when it's finished, but also has a bunch of other functionality you might need when running parallel code, such as canceling a long-running task.
Now we need to wait for the result of each call. Calling result() waits until a submitted task finishes, and returns the result of the call:
status_str = status_future.result()
The result assigned to status_str will be the string that the GitHub API returns when we check the user's authentication status.
When all the results have been returned, we can parse the results:
_parse_status(status_str)
This line, and the other parsing calls, are outside the with block. They only happen after all the fetching API calls have finished. These functions parse the strings that were returned into Python objects that can more easily be analyzed and presented.
You don't have to understand all this in detail to use ThreadPoolExecutor to make a batch of function calls more efficiently. You can copy the structure of this approach, and you'll start to build an understanding of what's happening.
A noticeable speedup
This code should make the overall project run faster. Here's the relevant updated cProfile data:
0.104 profile_utils.py:16(ensure_gh)
0.529 profile_utils.py:31(get_data)
0.000 analysis_utils.py:11(process_data)
0.000 summary_utils.py:8(show_summary)
The call to get_data() is more than a full second faster.
One of the nice things about uv is that it's really easy to compare two versions of a tool against each other. gh-profiler 0.5.1 was the last version with serial fetching, and 0.6.1 was the first version where all fetches are done in parallel. Here's the comparison, after making a couple runs to make sure we're not counting installation time:
$ time uvx gh-profiler@0.5.1 ehmatthes
    0.26s user 0.13s system 22% cpu 1.719 total
$ time uvx gh-profiler@0.6.1 ehmatthes
    0.27s user 0.13s system 62% cpu 0.638 total
Overall execution time, without running a profiler, dropped from about 1.7s to 0.6s when targeting my account.
That was expected, and it was nice to see the result confirm that this is a better approach.
A surprising benefit
I was quite happy to realize another, unexpected benefit. Here's a look at all the fetching calls, when run with cProfile:
0.706 profile_utils.py:130(_fetch_pr_activity)
0.661 profile_utils.py:160(_fetch_issue_activity)
0.438 profile_utils.py:70(_fetch_status)
0.394 profile_utils.py:89(_fetch_profile_dict)
0.380 profile_utils.py:111(_fetch_socials)
This was a run against my profile. Here's another run, against a user with a higher volume of issue activity:
4.154 profile_utils.py:160(_fetch_issue_activity)
0.648 profile_utils.py:130(_fetch_pr_activity)
0.375 profile_utils.py:111(_fetch_socials)
0.360 profile_utils.py:89(_fetch_profile_dict)
0.359 profile_utils.py:70(_fetch_status)
In both of these cases, the two slowest calls are the ones that fetch the issue and PR activity.
While looking at this output, I realized that since all the calls were being made in parallel, the entire batch should always take about as long as the slowest call in the batch. That means any additional calls we want to make are essentially free; they shouldn't slow down the overall execution time at all. They might make it a bit slower because there's another call to manage, but an additional 0.3s call won't incur a 0.3s penalty on the overall execution time.
Benchmarking with external API calls
To test this hypothesis, I wanted to bring back the explicit check for the user's authentication status. But I wanted to know for sure whether I'm really getting this additional functionality for free.
Benchmarking the performance of a project that depends on external API calls is always a bit inconsistent, so I wrote a small benchmarking script. GitHub isn't known for consistent performance these days, so the script rejects runs that take longer than 5s, and collects the execution time of 5 successful runs. It then shows some helpful stats about the performance of the given state of the project. uvx and Git tags make it easy to benchmark the latest version, or any previous state of the project as well.
Here are the performance benchmarks before adding the auth check back in:
$ uv run developer_resources/benchmark.py
Successful run: 0.8 sec
...

Minimum time: 0.75 sec
Median time:  0.8 sec
All times:    0.8, 0.9, 0.91, 0.75, 0.75
The minimum and median times give a range we can benchmark against. The current version takes about 0.75-0.8s when run against my own profile.
My argument is that adding an auth check back in, which takes about 0.3s serially, should end up with an overall execution time closer to 0.8s than 1.1s.
Bringing back the auth check
Including an explicit auth check means fetching the user's status, getting the output from that fetch, and parsing the output:
def get_data():
    """Get all data we'll need from GitHub."""
    with ThreadPoolExecutor() as executor:
        # Make fetching calls.
        status_future = executor.submit(_fetch_status)
        profile_dict_future = executor.submit(_fetch_profile_dict)
        ...

        # When each call finishes, store the result.
        status_str = status_future.result()
        profile_dict_str = profile_dict_future.result()
        ...

    # Parse data. This should only happen after all data has been fetched.
    _parse_status(status_str)
    _parse_profile_dict(profile_dict_str)
    ...
Here's the benchmark after adding that auth check back in:
$ uv run developer_resources/benchmark.py
Successful run: 0.78 sec
Successful run: 0.65 sec
...

Minimum time: 0.65 sec
Median time:  0.77 sec
All times:    0.78, 0.65, 0.81, 0.73, 0.77
It actually ran faster run with the auth check than without it. That's probably due to inconsistencies in GitHub's API performance, but the point is that it didn't add an ~0.3s penalty to the overall execution time.
An even more thorough benchmark
I love these kinds of experiments, so I pulled the auth check out of the parallel block:
def get_data():
    """Get all data we'll need from GitHub."""
    status_str = _fetch_status()
    with ThreadPoolExecutor() as executor:
        # Make fetching calls.
        # status_future = executor.submit(_fetch_status)
        profile_dict_future = executor.submit(_fetch_profile_dict)
        ...

        # When each call finishes, store the result.
        # status_str = status_future.result()
        profile_dict_str = profile_dict_future.result()
        ...

    # Parse data. This should only happen after all data has been fetched.
    _parse_status(status_str)
    _parse_profile_dict(profile_dict_str)
    ...
The value of status_str is now fetched by a non-parallel call to _fetch_status().
This should incur a ~0.3s penalty during benchmarking. We should see execution times around 1-1.1s:
$ uv run developer_resources/benchmark.py
...
Minimum time: 1.02 sec
Median time:  1.09 sec
All times:    1.11, 1.12, 1.05, 1.02, 1.09
That's exactly what we see! The parallel approach really does let us make additional calls like the explicit auth check essentially for free.
Conclusions
Rewriting serial code to implement a parallel approach doesn't always make things better, but it's certainly worth trying in many situations. When parallel approaches help, they tend to make things faster, but can also unlock some other benefits as well.
This is really helpful for gh-profiler. There are lots of signals about a user's open source activity that we might want to collect data about. People have been sharing the kinds of patterns they're seeing from problematic contributors, that the tool is not currently checking for. Some of these patterns can be detected with additional analysis of the data that's already being gathered. But some signals will require fetching additional bits of data about the user's activity. A 0.1-0.5s penalty for each new query would be problematic, because the tool would be much less usable if it got significantly slower. But being able to make small queries essentially for free means we can do a whole lot more analysis without impacting performance much at all.
Finally, this is another reason to strive for fluency with Git, or whichever version control tool you prefer. Being comfortable with version control makes experiments like the ones described here much easier to run. Most of this benchmarking and comparison was done by checking out various Git commits and tags. The ability to easily run any version of a project with uvx also makes this kind of experimentation much easier, and is worth becoming comfortable with as well.
If you have any thoughts about the evaluations that gh-profiler is doing, please share them in some way. You can open an issue, jump into a discussion, or email me if you'd like to keep the conversation private.