Testing a book's code, part 5: Testing Plotly data visualizations
MP 82: Testing complex HTML output, and output that varies based on API calls.
Note: This is the fifth post in a series about testing.
In the previous post we tested the output of programs that use Matplotlib to generate plots. Most of that work focused on testing output images, but we also dealt with randomness and metadata.
In this post we’ll test programs that use Plotly to generate visualizations. We’ll use some of what we learned in the Matplotlib tests, but we’ll also run into some new challenges in this test suite. For example, what do you do when two 3.4MB HTML files differ by only 100 characters?
Rolling dice
The first three programs we need to test simulate rolling a variety of dice. Here’s the structure of the first program:
# Create a D6.
die = Die()

# Make some rolls, and store results in a list.
results = []
for roll_num in range(1000):
    ...

# Analyze the results.
frequencies = []
...

# Visualize the results.
title = "Results of Rolling One D6 1,000 Times"
labels = {'x': 'Result', 'y': 'Frequency of Result'}
fig = px.bar(x=poss_results, y=frequencies, title=title, labels=labels)
fig.show()
This program creates a model of a six-sided die, makes 1,000 rolls, and generates a histogram of the results:
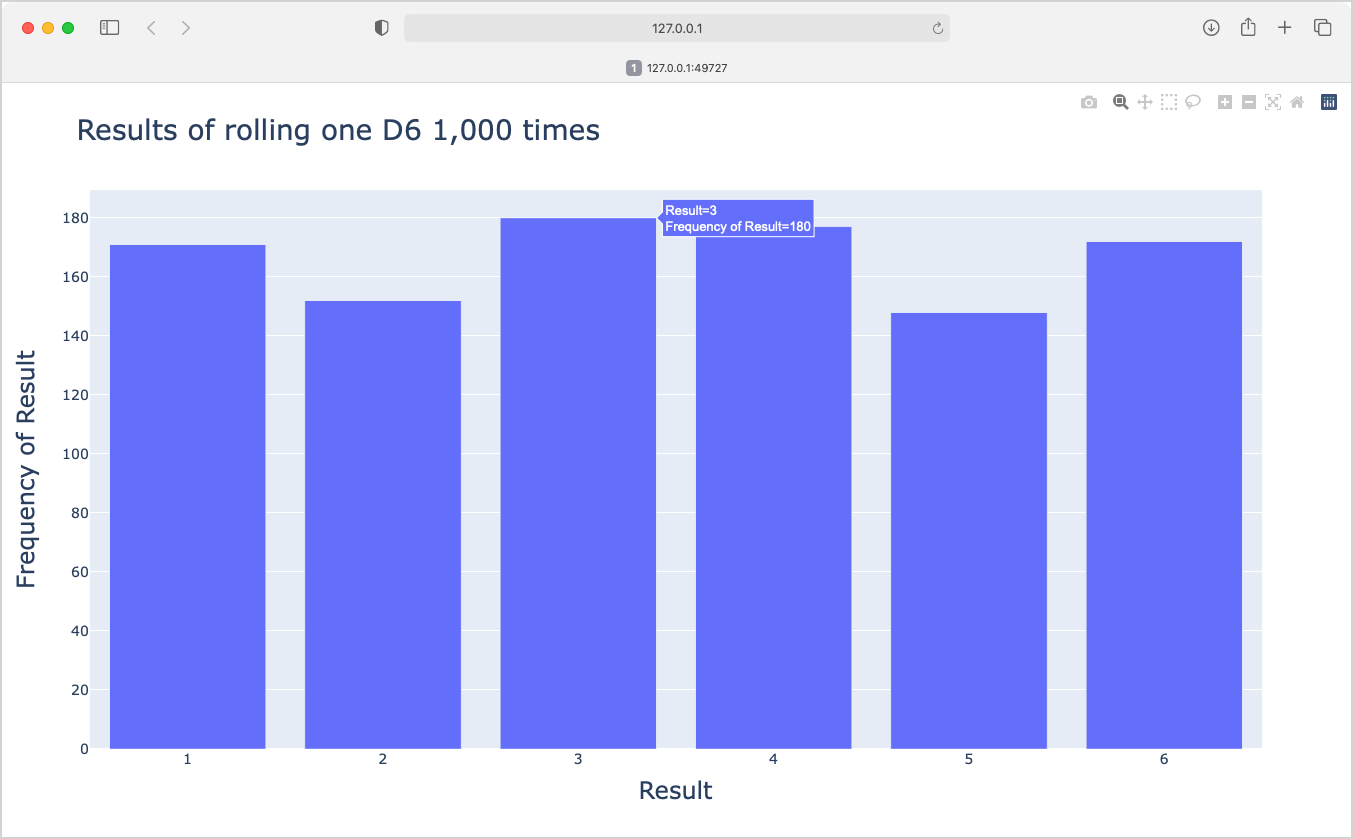
fig.show(), Plotly generates an HTML file that shows the plot in a browser tab.The fig.show() method writes an HTML file to a temporary location, and opens that file in a browser. In the test function, we’ll replace fig.show() with a call to fig.write_html(), and then work with that HTML file directly.
Testing die programs
In a new test module, test_plotly_programs.py, we’ll first copy the files we need to a temp directory:
from pathlib import Path
import os, shutil, filecmp

import pytest

import utils

die_programs = [
    "chapter_15/rolling_dice/die_visual.py",
]

@pytest.mark.parametrize("test_file", die_programs)
def test_die_program(tmp_path, python_cmd, test_file):

    # Copy program file to temp dir.
    path = Path(__file__).parents[1] / test_file
    dest_path = tmp_path / path.name
    shutil.copy(path, dest_path)

    # Copy die.py to temp dir.
    path_die = path.parent / "die.py"
    dest_path_die = tmp_path / "die.py"
    shutil.copy(path_die, dest_path_die)
We set this up as a parametrized test, so it will be easy to test the other die-rolling programs. We copy the program file, in this case die_visual.py, to the temp directory. We also copy the file die.py, which contains the class Die.
Next we’ll modify the copy of die_visual.py in the temp directory:
def test_die_program(...):
    ...

    # Modify the program file for testing.
    # Read all lines except fig.show().
    lines = dest_path.read_text().splitlines()[:-1]

    # Set random seed.
    lines.insert(0, "import random")
    lines.insert(5, "random.seed(23)")

    # Add the call to fig.write_html().
    output_filename = path.name.replace(".py", ".html")
    save_cmd = f'fig.write_html("{output_filename}")'
    lines.append(save_cmd)

    contents = "\n".join(lines)
    dest_path.write_text(contents)
We read all lines except the last one, set a random seed, and add a call to write_html(). When you run the test, you can go into the temp directory and see that the program is being rewritten correctly.1
An amusing mistake
As a side note, it sometimes bothers me when authors of technical writeups give the impression they ran into no issues when carrying out a long series of steps. That’s part of why I often mention the mistakes I make along the way, and show versions that don’t work followed by a version that does work.
Here’s what the modified die_visual.py file looked like at one point in my development process:
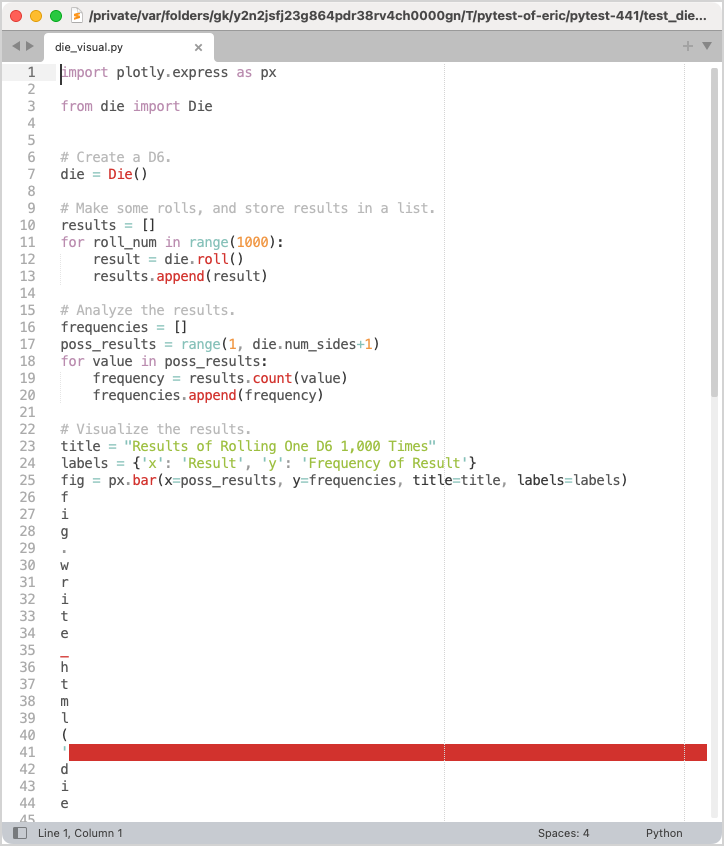
I had written lines += save_cmd, rather than lines.append(save_cmd). This treated the string save_cmd as a sequence, and added each character in the string as an individual item to lines. It’s always worth reiterating that everyone makes these kinds of mistakes, even if you don’t always see them shared publicly.
Now we can run the file, and verify that the output HTML file exists:
def test_die_program(...):
    ...

    # Run the program.
    os.chdir(tmp_path)
    cmd = f"{python_cmd} {path.name}"
    output = utils.run_command(cmd)

    # Verify the output file exists.
    output_path = tmp_path / output_filename
    assert output_path.exists()

    # Print output file path, so it's easy to find.
    print("\n***** Plotly output:", output_path)
This test passes, and we can open the resulting die_visual.html and make sure it matches the plot that fig.show() generated.
So let’s copy die_visual.html to tests/reference_files/, and make an assertion that the output file matches the reference file:
def test_die_program(...):
    ...

    reference_file_path = (Path(__file__).parent /
        "reference_files" / output_filename)
    assert filecmp.cmp(output_path, reference_file_path)
This is the same kind of comparison we made for all the Matplotlib files.
I’ve copied the die_visual.html file to tests/reference_files/, but this test fails:
$ pytest tests/test_plotly_programs.py -qs
>   assert filecmp.cmp(output_path, reference_file_path)
E   AssertionError: assert False
1 failed in 0.95s
Another file comparison rabbit hole
It’s time to jump into another file comparison rabbit hole. We have an output HTML file that looks identical to a reference HTML file, when viewed in a browser. Both files are about 3.6MB in size; that’s a lot of HTML to try to look through in a browser’s inspector pane.
I ended up copying the two files to a separate directory, and wrote a short script to examine the contents of the two files. I wrote a loop to run through every character in each file, and print the sections where the two files differed. It turns out these two files each have over 3,000,000 characters, and they only differ by about 100 characters. Going back to the inspector and knowing what to look for, I can see the difference:
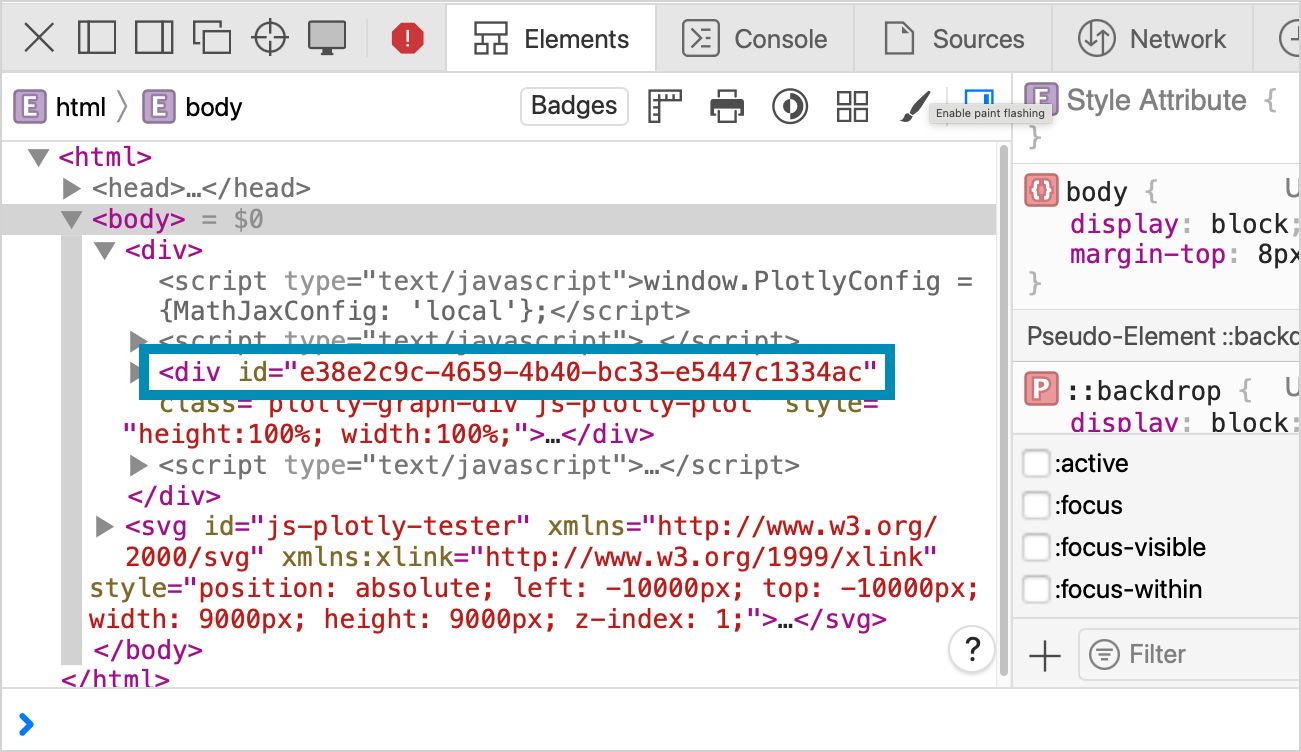
I learned a couple things about the HTML files that Plotly writes when you call fig.write_html() with the default settings:
- The files are large because they include an inlined version of plotly.js. This is what allows a browser to render the HTML file without making any network calls.
- The files include a hash that’s used as an ID on the main plot element. This hash ID is a unique value generated every time you run a Plotly program.
Testing often leads to a deeper understanding of the libraries we’re working with. That’s a burden, but much of what we learn ends up being useful at a later time.
Modifying output files for testing
With this clarification about how Plotly’s HTML files are structured, we can revise the output file for testing purposes. We’ll replace the unique hash ID with a dummy ID that’s the same for the reference file and the freshly generated output file.
Here’s the code that replaces the 36-character hash ID with the string 'dummy-id':
...
import os, shutil, filecmp, re
...

def test_die_program(...):
    ...

    # Verify the output file exists.
    output_path = tmp_path / output_filename
    assert output_path.exists()

    # Replace hash ID with a static dummy ID.
    contents = output_path.read_text()
    hash_id = re.search(r'div id="([a-f0-9\-]{36})"',
            contents).group(1)
    contents = contents.replace(hash_id, "dummy-id")
    output_path.write_text(contents)

    reference_file_path = (Path(__file__).parent /
        "reference_files" / output_filename)
    assert filecmp.cmp(output_path, reference_file_path)
We read the contents of the output file, and use a regular expression to replace the original hash ID with the string "dummy-id". We then rewrite the output file with the updated contents.
Now we can run this test again, and verify that the new version of die_visual.html is correct. It is, so we copy die_visual.html with the dummy ID to reference_files/, and the test should pass:
$ pytest tests/test_plotly_programs.py -qs
.
1 passed in 0.92s
Testing all the die programs
With parametrization, there’s very little to do in order to test the other two die plots. We add the two files to the list of plots to test:
die_programs = [
    "chapter_15/rolling_dice/die_visual.py",
    "chapter_15/rolling_dice/dice_visual.py",
    "chapter_15/rolling_dice/dice_visual_d6d10.py",
]
We then run the tests and copy the output files from these two programs, dice_visual.html and dice_visual_d6d10.html, to reference_files/.
Now all three tests pass:
$ pytest tests/test_plotly_programs.py -qs
...
3 passed in 1.81s
You could probably speed up this test by generating a version of the HTML file without the inlined plotly.js library. But this test is much more useful if I can go into the temp directory, click on the output file, and see the actual plot that was generated.
The utils.replace_plotly_hash() function
We’re going to need to replace Plotly hashes in another test, so let’s move that code to a utility function in utils.py:
def replace_plotly_hash(path):
    """Replace Plotly's unique hash ID with "dummy-id"."""
    contents = path.read_text()
    hash_id = re.search(r'div id="([a-f0-9\-]{36})"',
            contents).group(1)
    contents = contents.replace(hash_id, "dummy-id")
    path.write_text(contents)
This simplifies the test function:
def test_die_program(...):
    ...

    # Verify the output file exists.
    output_path = tmp_path / output_filename
    assert output_path.exists()

    utils.replace_plotly_hash(output_path)

    reference_file_path = (Path(__file__).parent /
        "reference_files" / output_filename)
    assert filecmp.cmp(output_path, reference_file_path)
Testing a map of global earthquake activity
The next project that needs to be tested is a plot of global earthquake activity. There’s no issue with changing data, because readers download a static data file containing a snapshot of earthquake activity from 2022.
The first file we need to test parses a GeoJSON file containing data from one day of earthquake activity. Here’s the test for that program:
def test_eq_explore_data(tmp_path, python_cmd):

    # Copy .py and data files to tmp dir.
    path_py = (Path(__file__).parents[1] / "chapter_16"
        / "mapping_global_datasets" / "eq_explore_data.py")
    ...

    # Run file.
    os.chdir(tmp_path)
    cmd = f"{python_cmd} {path_py.name}"
    output = utils.run_command(cmd)

    assert output == "[1.6, 1.6, 2.2, 3.7,...]"
The program eq_explore_data.py reads in earthquake data, and prints out a list of earthquake magnitudes. We assert that this output is correct; there’s no plot to check here.
The file eq_world_map.py processes a longer set of earthquake data, and generates a map of those events. The test for this program uses what we learned earlier about testing HTML output from Plotly:
def test_eq_world_map(tmp_path, python_cmd):

    # Copy .py and data files to tmp dir.
    path_py = (Path(__file__).parents[1] / "chapter_16"
        / "mapping_global_datasets" / "eq_world_map.py")
    ...

    # Modify the program file for testing.
    lines = dest_path_py.read_text().splitlines()[:-1]
    ...

    # Run file.
    os.chdir(tmp_path)
    ...

    reference_file_path = (Path(__file__).parent /
        "reference_files" / output_filename)
    assert filecmp.cmp(output_path, reference_file_path)
We copy the relevant .py and data files, modify them for testing, and then compare them to the reference file. You can run this test, verify the output file is correct, and copy it to reference_files/.
We now have five passing tests for Plotly programs:
$ pytest tests/test_plotly_programs.py -qs
.....
5 passed in 2.34s
Testing a plot image that changes regularly
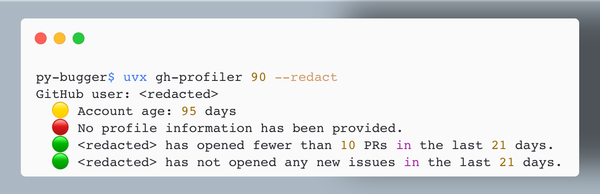
The last plot we’ll need to test is based on a call to GitHub’s API, requesting the current most popular Python repositories. Here’s the plot for a recent run of the program:
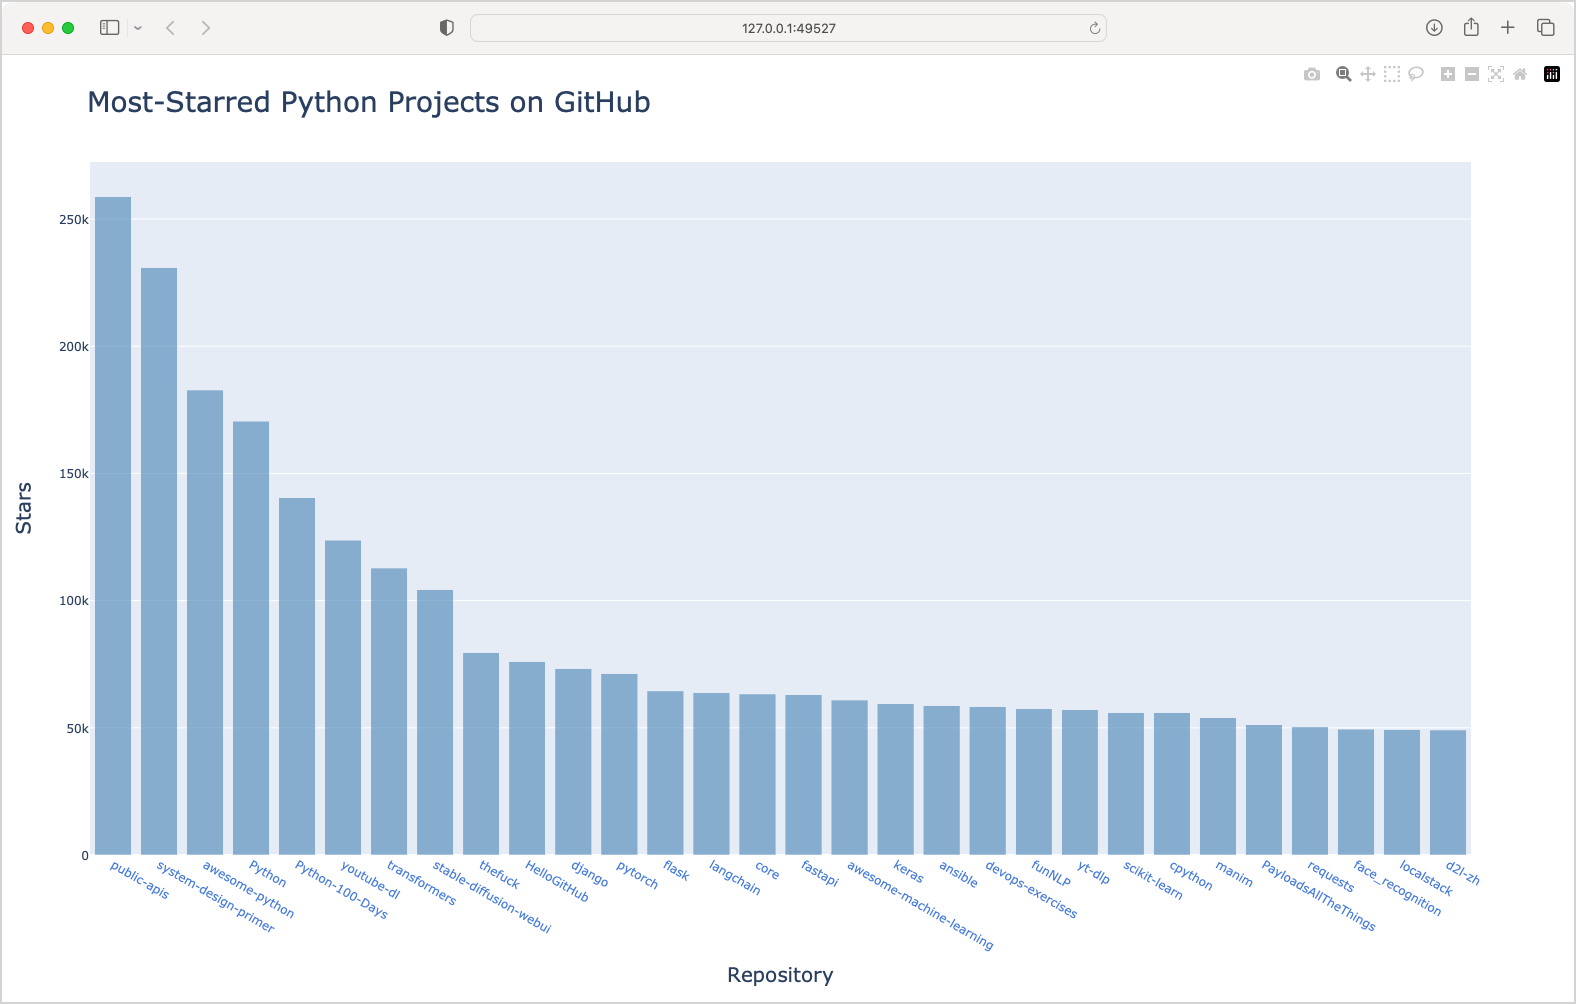
This plot looks mostly the same as the one in the book. However, the plot will look slightly different every time you generate it. The relative bar heights change slightly, and the positions of the projects can change. A simple call to filecmp.cmp() comparing this HTML file against a reference file will almost always fail.
What aspects of the plot are consistent over time? The shape of the plot should show a sharp drop-off over the the first few projects, unless something changes drastically in the ecosystem. The colors should stay the same, and the amount of text on the plot should be fairly stable. Taking all this into account, I’m going to assume that the average of all pixels’ RGB values will remain fairly constant over the life of this project.
I’ll generate a static image of this plot, average the RGB values for all pixels in the image, and assert that this value is within a very narrow range. If this test ever fails and the plot is still correct, I’ll widen the threshold for passing this test. I might miss something, but this will identify a wide range of issues: an empty plot, a plot with no labels, a plot where the colors have changed, or any number of other issues that are likely to come up over several years of using an evolving plotting library.
Testing the API call
The program python_repos.py makes the API call that we want to plot, and prints out selected information from the results.
Here’s the test for that program:
def test_python_repos_py(python_cmd):
    path = (Path(__file__).parents[1] / "chapter_17"
        / "python_repos.py")
    cmd = f"{python_cmd} {path}"
    output = utils.run_command(cmd)

    assert "Status code: 200" in output
    assert "Complete results: ..." in output
    ...
This program makes an API call, but it doesn’t write any files, so we don’t need to run it in a temp directory. All we need to do is make assertions about the terminal output the program generates.
Note: I found later that the value for cmd needs to be f"{python_cmd} {path.as_posix()}" to work on Windows. This doesn’t affect behavior on macOS. Also note that python_repos.py requires the requests package.
Testing the plot image
Now we can test the program that generates a plot of the most popular repositories. We’ll need to install kaleido, a library that Plotly uses to generate static images.
Here’s the test for python_repos_visual.py:
...
from PIL import Image
import numpy as np

...
def test_python_repos_visual(tmp_path, python_cmd):
    # Copy program file to tmp dir.
    ...

    # Add a call to fig.write_image().
    output_filename = path.name.replace(".py", ".png")
    save_cmd = f'fig.write_image("{output_filename}")'
    lines.append(save_cmd)
    ...

    # Run file.
    ...

    # Get average pixel value.
    with Image.open(output_path) as img:
        img = img.convert("RGB")
        data = np.array(img)
        mean_rgb = np.mean(data)
        print("\n***** mean_rgb:", mean_rgb)

    # As of 9/23/23, mean_rgb is 239.45.
    # Widen threshold if this fails with a valid image file.
    assert 238 < mean_rgb < 242

    # Check output.
    assert output == "Status code: 200..."
We need to import the Image class from Pillow, along with numpy. Most of this test function looks like previous Plotly test functions. We copy the file python_repos_visual.py to the temp directory, and modify it for testing. Instead of adding a call to write_html(), we instead call fig.write_image(). This writes a static PNG image instead of an HTML file:
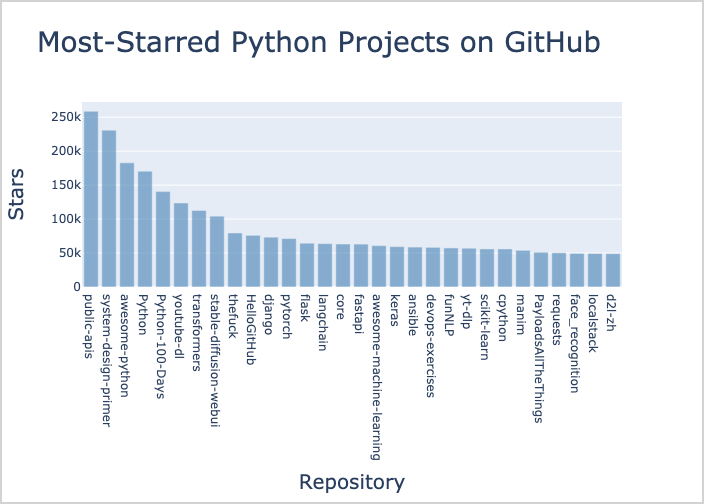
Once the output image file has been generated we open it with Pillow, and extract the image data into a NumPy array. The call to np.mean(data) quickly calculates the mean RGB value of all pixels in the image. Printing this value shows that it’s currently about 239.45. That makes sense; there are a lot of white pixels in the background, and the plot’s background is fairly light as well.
Here I’m asserting that the value for mean_rgb should lie between 238 and 242; if it’s outside of this range, this test will fail and I can then check if something has gone wrong, or if the data has simply changed enough to push the value of mean_rgb out of the current range. I would be interested in seeing this plot in either of those cases.
We don’t need a reference file for this test, because we’re just making an assertion about the pixels in the output file. We also assert that the text output reports a status code of 200 for the successful API call, and nothing else.
This test takes about three seconds to run on my system. I tried reducing the image size, but that didn’t speed up the test noticeably.
Testing HN programs
I grouped two more programs in with the Plotly tests, because they’re in the same chapter. The focus of this chapter is making API calls, and the chapter closes with a couple programs that make calls to the Hacker News API.
I won’t show these test functions here, because they don’t add much more to the discussion. The only thing to note is that one example in the book makes a series of 30 API calls, to retrieve all the information for each of 30 posts on the front page of HN. The test function modifies this program to only make two calls, as there is no need to make so many API calls during a test run.
Specifying the Plotly version
Now that all the tests work for the current version of Plotly, let’s add the CLI arg and fixture to run tests against any version of Plotly we want.
Here’s conftest.py:
def pytest_addoption(parser):
    ...
    parser.addoption(
        "--plotly-version", action="store",
        default=None,
        help="Plotly version to test"
    )
This supports testing calls such as:
$ pytest test/test_plotly_programs.py --plotly-version 5.16.1And here’s the fixture to check for this option in test_plotly_programs.py:
@pytest.fixture(scope="module", autouse=True)
def check_plotly_version(request, python_cmd):
    """Check if the correct version of Plotly is installed."""
    utils.check_library_version(request, python_cmd, "plotly")
This is the same structure we used for specifying the version of Pygame and Matplotlib.
Unfortunately, most tests fail with a different version of Plotly. A bit of investigation showed that this is due to the inlined plotly.js file. The version of plotly.js is embedded in the HTML file. You could try to manually remove plotly.js from the HTML file, but we might as well just use a modified call to write_html():
fig.write_html(<output_filename>, include_plotlyjs=False)This writes the data to an HTML file, without an inline version of plotly.js. This kind of file is meant to be included on a web page with multiple plots, and either a network call to include plotly.js, or a single inlined version of the library.
I chose to make two calls to write_html() in each test file, like this:
fig.write_html("die_visual.html")
fig.write_html("die_visual_nojs.html", include_plotlyjs=False)
After a test run, I can open die_visual.html in a browser and see the plot. But the assertion comparing the output to a reference file is done using the version of the HTML file without plotly.js included. This version is not affected by changes to plotly.js across different versions of Plotly’s Python library.
The main change to the test function is a call to a utility function that adds both write_html() calls to the test version of the .py file:
def test_die_program(tmp_path, python_cmd, test_file):
    ...
    # Write HTML with and without plotly.js.
    lines = utils.add_plotly_write_commands(path, lines)
    ...
You can see the full updated versions of these files here.
Now the tests pass against multiple recent versions of Plotly:
$ pytest tests/test_plotly_programs.py -qs
*** Running tests with plotly==5.18.0
.........
***** Tests were run with: Python 3.11.5
9 passed in 8.51s

$ pytest tests/test_plotly_programs.py -qs --plotly-version 5.17.0
*** Running tests with plotly==5.17.0
.........
--- Resetting test venv ---
Successfully installed plotly-5.18.0
--- Finished resetting test venv ---
***** Tests were run with: Python 3.11.5
9 passed in 26.65s
I will note that other tests sometimes fail after testing different versions. For example the Matplotlib tests started failing at one point, and a simple uninstall/reinstall of Matplotlib fixed the issue. I’m not sure if the virtual environment ends up in a broken state. It makes me wonder if there are common dependencies between Matplotlib and Plotly, and those dependencies end up incompatible with the library that didn’t change versions.
If these issues persist, I’ll probably build a fresh virtual environment at the end of any test run that uses a different version of a library, but I’m not seeing a need for that yet.
Running tests on Windows
When I tried to run all the Plotly tests on Windows, I found that the tests involving API calls failed. Both failures were due to encoding issues. These issues can be a bit confusing to resolve, because we have a number of layers involved in the test run: the console where the tests are running, and the subprocesses where the actual programs are being run.
I added a session-level fixture to set the PYTHONIOENCODING environment variable to "utf-8" on Windows. I also added an explicit encoding argument to the run_command() utility function.
Conclusions
As is often the case in testing real-world projects, most of the challenges that have come up aren’t really about using a testing library such as pytest. Rather, most of the challenges come from looking for consistency in dynamic output.
In this post we’ve had to deal with randomness, unique hash IDs that change across every single test run, and bundled libraries that change on a regular basis. We also had to deal with visualization output that should be broadly consistent over time, but can never be exactly the same due to a dependence on API calls.
Once you learn to use things like fixtures and parametrization, much of your testing work comes down to dealing with other issues like this. If you’re clear about what you want to get out of your test suite, you can almost always find meaningful ways to address whatever comes up in your testing work. For example I could have taken a snapshot of the data from an API call, and test that a visualization of that data is always the same as a reference image. But I’d rather know that a valid plot is made from a current API call, because that’s what my readers are doing. You’ll likely come up against similar challenges in your testing work, but your solution should match your testing goals. You shouldn’t try to match my testing goals, and you shouldn’t try to meet some “testing ideal” of perfectly consistent output.
This is part of why I love testing; it’s not a dry exercise of going over work you’ve already done. It pushes you to understand your own code better, to think about your project in very specific ways, and to understand the libraries you depend on more thoroughly.
Resources
You can find the code files from this post in the mp_testing_pcc_3e GitHub repository.
These programs use Plotly Express, which requires pandas even when it’s not used directly. If you’re following along on your own, remember to install Plotly and pandas, and then update the requirements file. ↩