OOP in Python, part 16: Class structure in Matplotlib
MP 61: Understanding how the Figure and Axes classes are implemented.
Note: This post is part of a series about OOP in Python. The previous post looked at how classes are used in the pathlib library. The next post discusses composition.
Matplotlib has two interfaces, one object-based and one function-based. For anything beyond simple plots, it's recommended to use the class-based API. In this post we'll make a simple plot using the object-oriented interface, and then use that plot to explore Matplotlib's internal implementation.
Using Matplotlib's object-oriented API
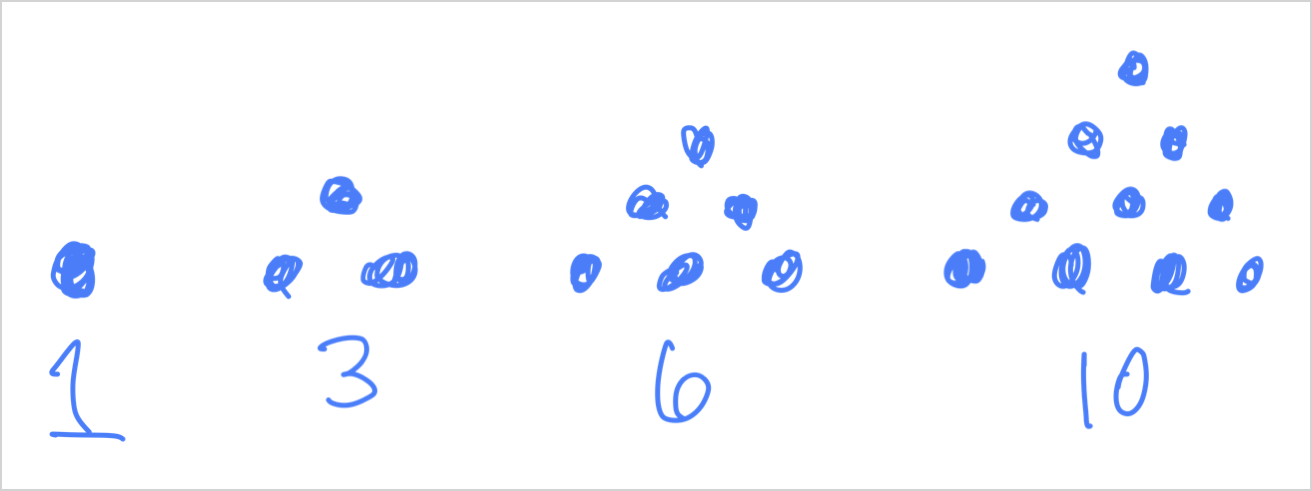
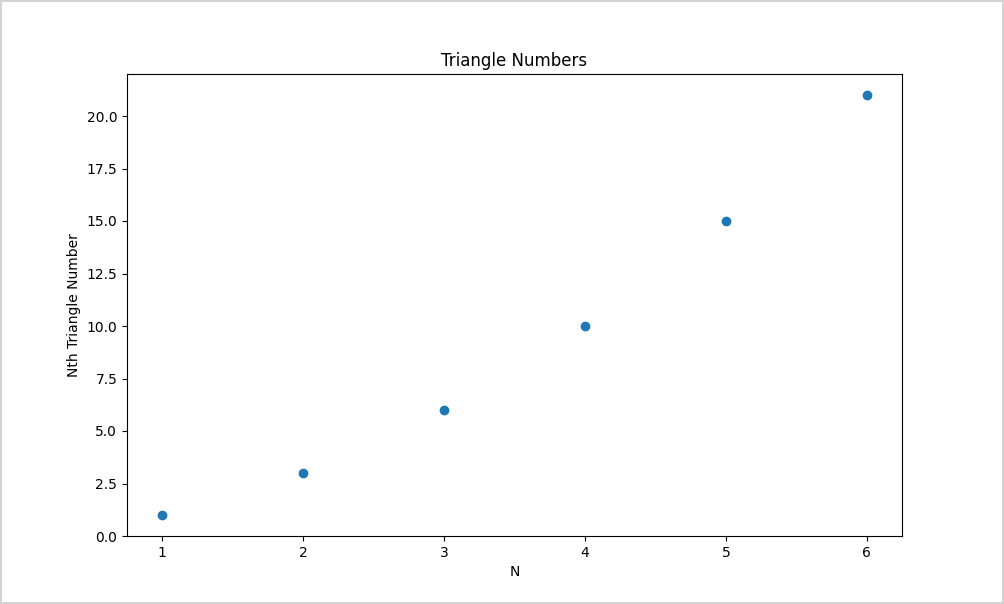
As an example, let's focus on triangle numbers. An integer is a triangle number if the corresponding number of dots can be arranged in a triangle, like this:
Here's a simple plot of the first six triangle numbers, using the object-oriented API for Matplotlib:
import matplotlib.pyplot as plt

# Generate data.
triangle_nums = [1, 3, 6, 10, 15, 21]
x_values = [1, 2, 3, 4, 5, 6]

# Generate plot.
fig, ax = plt.subplots()
ax.scatter(x_values, triangle_nums)

# Format plot.
ax.set_title("Triangle Numbers")
ax.set_xlabel("N")
ax.set_ylabel("Nth Triangle Number")

# Show plot.
plt.show()
After defining the data, we call plt.subplots(). Understanding this one line is the key to understanding Matplotlib's object-oriented interface:
fig, ax = plt.subplots()The plt.subplots() function returns two objects: a Figure object, and an Axes object. We'll inspect those in a moment, and then explore the Matplotlib codebase to see how those two classes are implemented. For now, just know that the Figure object refers to the overall set of plots; it's designed to manage more than one plot. The ax object refers to a single plot; the name ax refers to a pair of axes.
The ax object has a number of plotting methods available. Here we call ax.scatter() to make a scatter plot. We then make a series of method calls that set the title, and label each axis. Finally, the call to plt.show() displays the plot in an interactive viewer:
Now that we have a plot, let’s use it to explore the internal implementation of Matplotlib.
The subplots() function
First, let’s take a look at the subplots() function. The code for this function is in pyplot.py:
def subplots(
    nrows: int = 1, ncols: int = 1, *,
    sharex: bool | Literal["none", "all", "row", "col"] = False,
    sharey: bool | Literal["none", "all", "row", "col"] = False,
    ...
    **fig_kw
) -> tuple[Figure, Any]:
    """
    Create a figure and a set of subplots.

    This utility wrapper makes it convenient to create common layouts of
    subplots, including the enclosing figure object, in a single call.
    ...
    """

    fig = figure(**fig_kw)
    axs = fig.subplots(nrows=nrows, ncols=ncols, ...)
    return fig, axs
The subplots() function can accept a number of parameters to help lay out multiple plots in one figure. These include parameters to control, for example, whether plots should share an x- or y-axis. Even though the function is designed to support adding multiple plots to a figure, the default is to create a single plot in the figure.
There are 150 lines of comments in this function, but there are just three lines of code. This function creates a figure, and then calls that figure’s subplots() method. It returns the figure and axes objects.
The fig and ax objects
Let’s see exactly what fig and ax refer to:
...
# Generate plot.
fig, ax = plt.subplots()
print(type(fig))
print(type(ax))
...
We print the type of each of these two objects:
$ python triangle_nums.py
<class 'matplotlib.figure.Figure'>
<class 'matplotlib.axes._axes.Axes'>
The fig object is an instance of the Figure class, which we can find in the file matplotlib/figure.py. The ax object is an instance of the Axes class, which we can find in matplotlib/axes/_axes.py.
The Figure class
Let’s look at the Figure class. Here’s the class definition, along with part of the docstring:
class Figure(FigureBase):
    """
    The top level container for all the plot elements.

    See `matplotlib.figure` for an index of class methods.
    ...
    """

    ...
    def __init__(self,
                 figsize=None,
                 dpi=None,
                 *,
                 facecolor=None,
                 edgecolor=None,
                 ...
                 **kwargs
                 ):
        ...
The Figure class inherits from FigureBase, which we’ll look at in a moment.
When you look at the source code for mature projects enough, you start to see clear connections between the project’s documentation and its internal structure. Here that connection is made explicit. The documentation page for the API Reference has a number of links to pages that focus on Figure, Axes, subplots(), and a few more of the most significant parts of the Matplotlib model. But it also has a listing for every module, and one of those is the matplotlib.figure reference we see mentioned here in the docstring.
Figure class parameters
This reference page lists such things as the parameters you can use when creating a Figure object. The last parameter in the definition of subplots() was **fig_kw. This allows subplots() to pass through any keyword arguments that are meant to be used when creating the Figure instance. These include arguments like figsize and dpi for controlling the size and resolution of output image files. One parameter is facecolor, which changes the “figure patch facecolor”.
Knowing that keyword arguments are passed through subplots(), we can just add a facecolor argument to our subplots() call and see exactly what gets colored:
fig, ax = plt.subplots(facecolor='#9ccbf0')This should color part of the figure; my guess is it will color the background area in the figure outside of any individual plots. Let’s see:
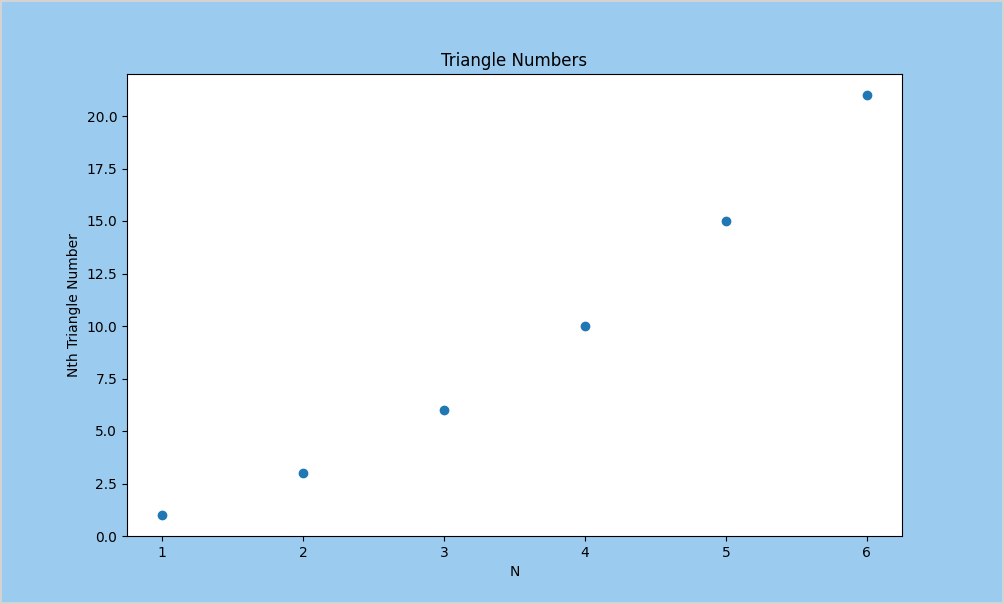
facecolor attribute is set to light blue.This worked. If your goal was to color the background of a figure, this isn’t the most straightforward way of figuring out how to do that. But exploring a library’s code almost always shows me see some capabilities of the library that I wasn’t previously aware of.
Figure class methods
The matplotlib.figures reference page also lists a number of methods available for Figure objects. One of these is text():
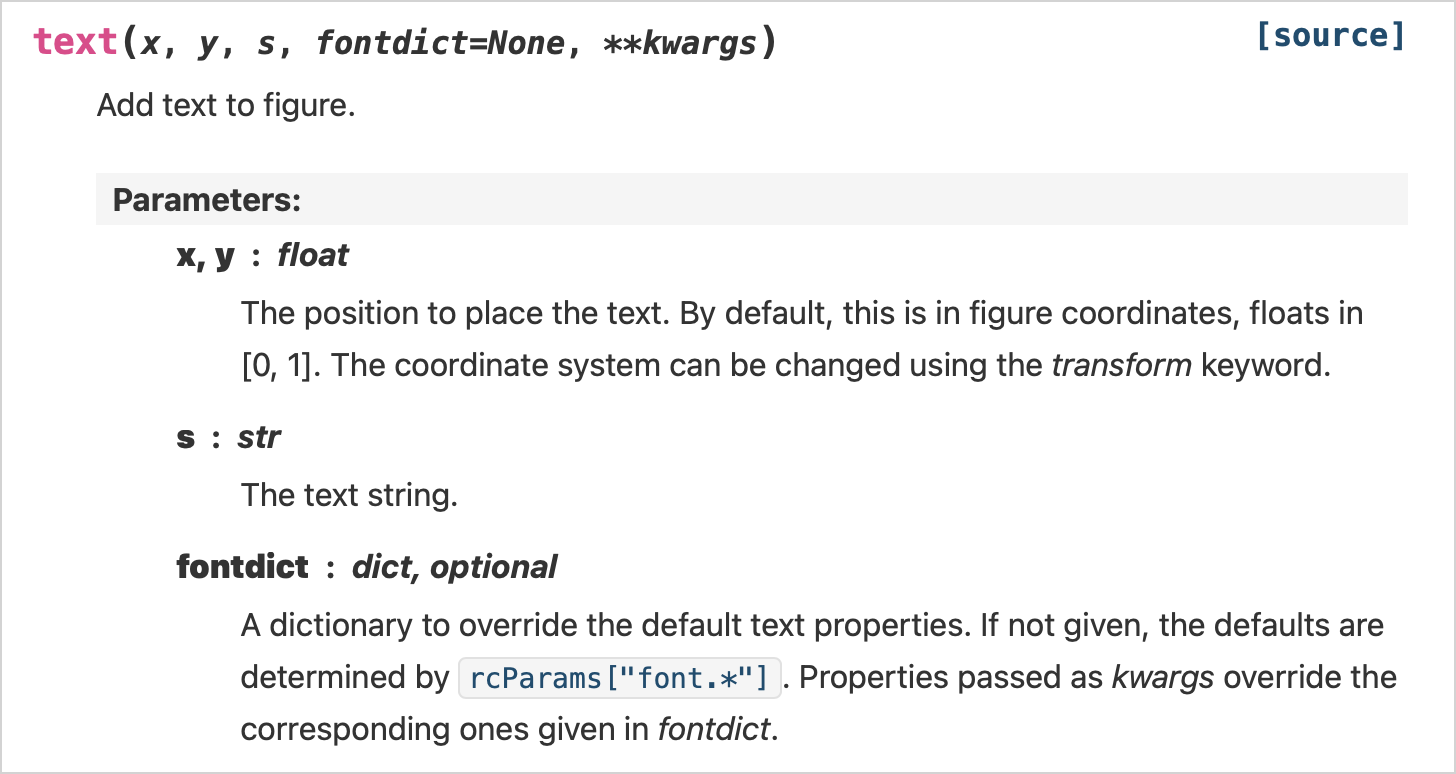
text() method in the Figure class.This method lets you add text to figures. Your text can overlap a plot that’s part of the figure, or it can exist outside of any plot. This could be used, for example, to add a footer to any figure you generate:
fig, ax = plt.subplots(facecolor='#9ccbf0')
fig.text(x=0.82, y=0.025, s="mostlypython.substack")
For placing objects, Matplotlib uses a range from 0 to 1, starting at the bottom left corner of the figure. The coordinates (0.82, 0.025) will place the text far to the right side of the figure, and near the bottom:
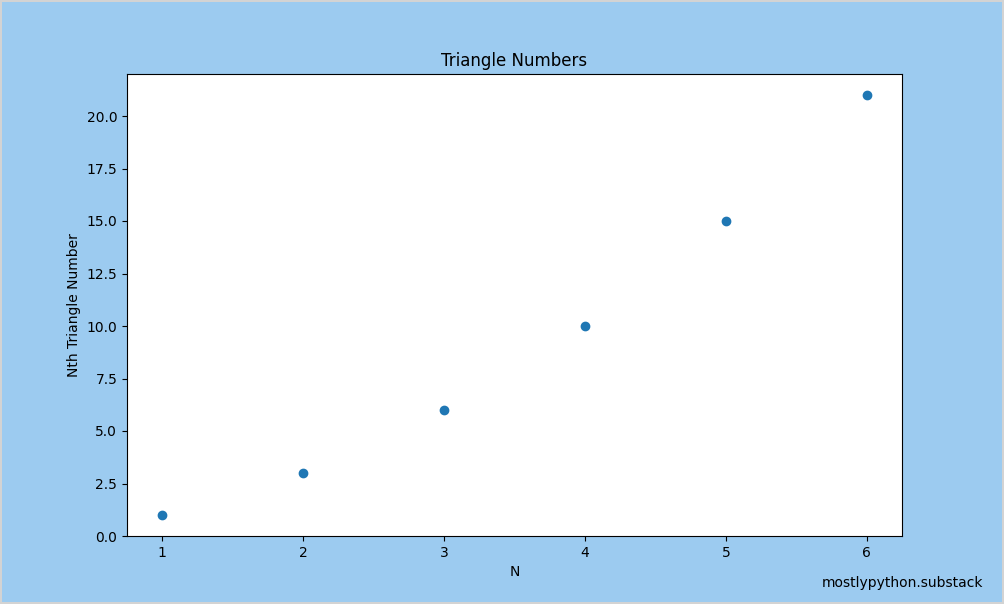
text() method can be used to add text outside the area of any individual plot.The documentation for Matplotlib can be overwhelming at first, because there’s so much information presented. But when you start to understand its overall structure, it becomes easier to navigate, and easier to predict how you might be able to achieve the visual effect you want. One strength of the documentation is the numerous direct links to specific parts of the codebase. For example the [source] link in the above documentation screenshot links to the definition of text() in figure.py, where we’ve been looking.
Here’s the implementation of text():
class Figure(FigureBase):
    ...

    def text(self, x, y, s, fontdict=None, **kwargs):
        ...

        text = Text(x=x, y=y, text=s, **effective_kwargs)
        text.set_figure(self)
        text.stale_callback = _stale_figure_callback

        self.texts.append(text)
        text._remove_method = self.texts.remove
        self.stale = True
        return text
This isn’t a whole lot of code. It creates an instance of the Text class; if you’re curious about the next layer of implementation, you can go look at that class. The current Figure instance (self) is passed to the set_figure() method; apparently the Text instance gets a reference to the Figure instance. There’s a bit more code, and then the text object is returned.
This overall OOP structure is what gives users such tremendous flexibility when generating Matplotlib plots. Even if you don’t use Matplotlib directly yourself, some plotting libraries such as Seaborn are built on top of Matplotlib. Newer plotting libraries like Seaborn take advantage of the flexibility that Matplotlib offers. They make opinionated decisions about a lot of styling and plotting options, so you don’t have to go so far down into the details of the plot. If you’re using one of those libraries, it’s helpful to know what they’re doing. It’s also helpful to know that you could still manipulate all these attributes yourself, and call any of these methods you might need to.
Matplotlib is documented well enough that you don’t need to explore its codebase in order to understand how to use the library. But if you make a habit of poking around codebases like this, you’ll be able to more effectively use (and troubleshoot) libraries that don’t have such thorough documentation.
The FigureBase class
Now let’s look at the next layer, the FigureBase class that Figure inherits from. Here’s the definition and docstring:
class FigureBase(Artist):
    """
    Base class for `.Figure` and `.SubFigure` containing the methods
    that add artists to the figure or subfigure, create Axes, etc.
    """
    ...
This class inherits from Artist. In Matplotlib, an artist is an “object that knows how to use a renderer to paint onto the canvas”.
The FigureBase class defines many of the methods that all figures need in order to be highly customizable. Here are a few examples of the kind of methods you’ll find there:
autofmt_xdate(): This method formats dates and times neatly along the x-axis.get_facecolor(): Gets the value offacecolor, which we used earlier.add_axes(): Adds an instance ofAxes(a single plot) to the figure.add_subplot(): This is another way to add a single plot, as part of a set of subplots, to the figure.
We’re almost at the end of this hierarchy. Let’s look at the implementation of Artist.
The Artist class
Here’s the definition of Artist:
class Artist:
    """
    Abstract base class for objects that render into a FigureCanvas.

    Typically, all visible elements in a figure are subclasses of
    Artist.
    """

    zorder = 0
    ...
This is referred to in the docstring as an “abstract base class”, even though it doesn’t use Python’s standard infrastructure for abstract base classes. Though not enforced by Python, this class isn’t meant to be instantiated. It’s only meant to be used through inheritance by other classes that implement specific rendering behavior. The zorder attribute allows different artists to work in layers as they generate a plot.
I won’t go through the individual methods in Artist. They implement all the detailed drawing functionality that’s needed to actually draw a highly customized plot to the screen.
The Axes class
Now that we’ve followed the Figure class hierarchy as far as it goes, let’s take a look at the Axes class.
Here’s the first few lines of Axes:
class Axes(_AxesBase):
    """
    An Axes object encapsulates all the elements of an individual
    (sub-)plot in a figure.
    ...
While a Figure object represents the overall collection of plots, even if there’s only one plot, an Axes object represents a single plot. A typical Axes object has an x- and a y-axis, tick marks, text, and more.
The _axes.py file has over 8,000 lines of code, and it only contains the Axes class. There’s a lot of code in this library, and it’s part of why newer plotting libraries tend to build on existing libraries instead of starting from scratch.
Now let’s look at _AxesBase.
The _AxesBase class
This is the last class we’ll look at, as it’s the root of the Axes class hierarchy.
Here’s the first part of this class:
class _AxesBase(martist.Artist):
    name = "rectilinear"

    # axis names are the prefixes for the attributes that contain the
    # respective axis; e.g. 'x' <-> self.xaxis, containing an XAxis.
    # Note that PolarAxes uses these attributes as well, so that we have
    # 'x' <-> self.xaxis, containing a ThetaAxis. In particular we
    # do not have 'theta' in _axis_names.
    # In practice, this is ('x', 'y') for all 2D Axes
    # and ('x', 'y', 'z') for Axes3D.
    _axis_names = ("x", "y")
    ...
The _AxesBase class inherits from the same Artist class we saw earlier. It’s listed as martist.Artist here because of how the artist module is imported:
import matplotlib.artist as martistWhen you dig through some of the most heavily used Python libraries, you can often find code that doesn’t follow most current Python conventions. Here we have a class with no docstring; it just jumps into attributes and comments about those attributes.
Every axis starts out with x- and y-axes, and sometimes a z- axis is added as well. I believe other kinds of plots, such as Polar plots, map specialized axes onto these x- and y- names. This class is quite long as well; it’s about 4,000 lines of code implementing behavior needed for all kinds of plots.
Conclusions
We’ve seen that object-oriented principles can help give structure to large codebases, and Matplotlib is a clear example of this. If a class needs a large number of methods to implement all of its necessary behavior, all those methods can give tremendous flexibility to end users in how they interact with the library. Matplotlib has been around for a long time, in no small part due to this flexibility.
Walking through the class hierarchy of a large project will almost certainly give you ideas about how you might implement your own complex projects. It will also give you better insight into the ways you use those projects. The documentation will make more sense, and you’ll start to see consistency in how specific tasks are carried out through methods on particular kinds of objects.
Resources
You can find the code files from this post in the mostly_python GitHub repository.