Inspecting your own code

MP 172: You don't have to consult documentation or AI assistants to learn more about the code you're working with.
Recently I was considering how to best explain a snippet of code, and I realized I've developed some habits for inspecting code blocks that people newer to Python might not know about. Most people using Python today are probably aware that documentation exists for the libraries they use, and many people regularly get help from a variety of AI-based tools. But are you aware of how much you can learn about your code with just a little inspection?
In this post I'll show how much you can learn about the code you're working with from just a brief debugging session, even if there are no bugs in your project.
A short example
Here's a short program that generates a meaningful plot:
import matplotlib.pyplot as plt

advantages = [
    0, 0, 0, 0, 0, 0, 0, 0, 1, 0, 1, -2, -2, -5, 4, 4, 4,
    4, 4, 4, 4, 4, 4, 4, 5, 5, 5, 5, 5, 5, 8, 8, 8, 8
]

fig, ax = plt.subplots(figsize=(1500, 900, "px"))
ax.plot(advantages)

plt.show()
This code has one piece of data, a list named advantages. This came from an actual chess game, where a number of trades and captures took place until one player developed a significant advantage and won the game.
The game is interesting because the winner gave up their knight and bishop in order to capture their opponent's queen. The list advantages represents the overall material advantage in the game after each player's move. Here's what the plot looks like:
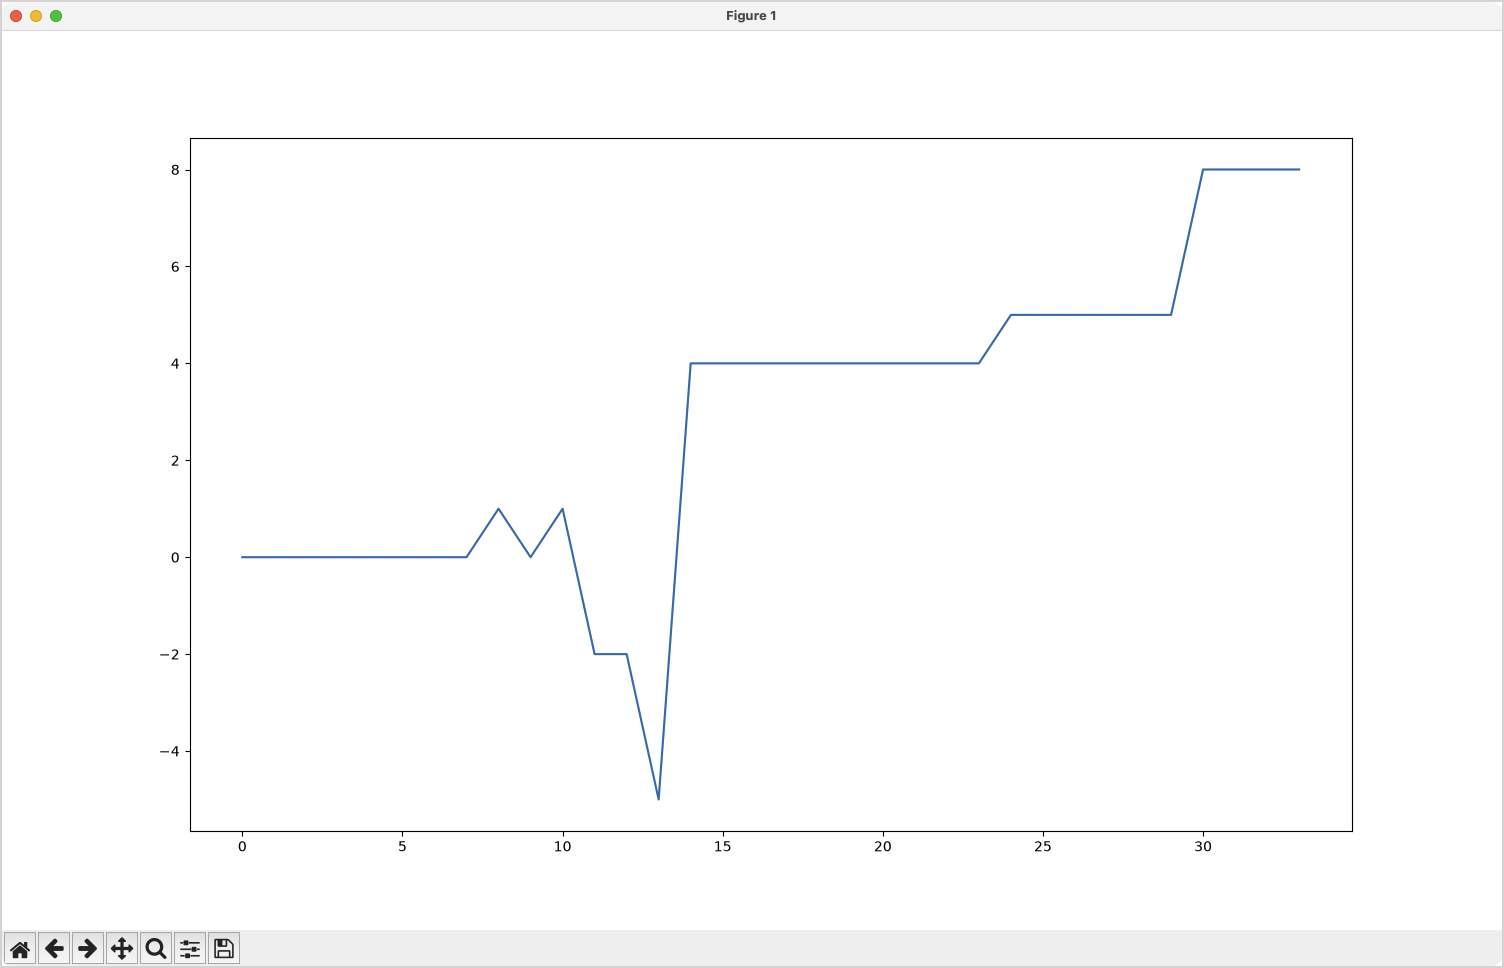
This is a graphical representation of a sacrifice in chess. The plot starts at zero, because both players start every game with even material. The two small bumps represent a pawn trade. The big drop represents the eventual winner first giving up their knight, and then their bishop; they're accepting a temporary material disadvantage in order to set a trap for the opponent's queen. The jump back above zero represents the queen capture. After that they go on to take two more pieces before reaching checkmate.
What are fig and ax?
If you've ever used Matplotlib, you've probably seen variables named fig and ax. But what do they represent? You can go look at the Matplotlib documentation and try to read about these variables, and you can ask an AI to explain them to you. But there's another option I think a lot of people aren't aware of. You can inspect your own code.
Let's see how it works
...
fig, ax = plt.subplots(figsize=(1500, 900, "px"))
breakpoint()
ax.plot(advantages)

plt.show()
First, add a breakpoint after the line that defines fig and ax. Now when you run the code, you can poke around and inspect these variables in a few different ways:
$ uv run main.py
> main.py(9)<module>()
-> breakpoint()
(Pdb)
Execution stops at the breakpoint, and we're free to run any code we want. Let's see what fig is:
(Pdb) fig
<Figure size 1500x900 with 1 Axes>
This shows that fig is an instance of the class Figure. That's useful information already! Instead of going to the documentation and trying to find something relevant, we can head there with a clearer purpose, looking for documentation about the Figure class.
But we don't need to do that quite yet. First, notice the rest of what we just found out. The instance fig has the size we specified, and it also contains 1 Axes instance.
Let's see what ax represents:
(Pdb) ax
<Axes: >
The ax variable refers to an instance of the Axes class. That's where the name ax comes from; it's not an axis, it's an instance of the Axes class. This information lets us visit the documentation with clearer focus as well.
But we're still not finished with the terminal.
The amazing help() function
Let's call help() on both these variables. We'll start with fig:
(Pdb) help(fig)
Help on Figure in module matplotlib.figure object:

class Figure(FigureBase)
 |  Figure(
 |      figsize=None,
 |      dpi=None,
 |      ...
 |  )
 |
 |  The top level container for all the plot elements.
 |
 |  See `matplotlib.figure` for an index of class methods.
 ...
 |      Parameters
 |      ----------
 |      figsize : (float, float) or (float, float, str), default: :rc:`figure.figsize`
 |          The figure dimensions. This can be...
 |
 |      dpi : float, default: :rc:`figure.dpi`
 |          Dots per inch.
 |
 |      facecolor : default: :rc:`figure.facecolor`
 |          The figure patch facecolor.
 |
 |      edgecolor : default: :rc:`figure.edgecolor`
 |          The figure patch edge color.
 |
 |      linewidth : float
 |          The linewidth of the frame (i.e. the edge linewidth of the figure
 |          patch).
 ...
If you've never run help() before, I hope this is as amazing to you as it is to me. From just a few lines of code, we're already learning a lot about exactly the things we were interested in.
Here's some of what to notice here:
- We can see a bit of how Matplotlib is structured internally. We're working with an instance of
Figure, and in the Matplotlib codebase, there's aFigureBaseclass thatFigureinherits from. These large, well-established libraries can seem difficult to dig into and understand. Little bits like this pull back the curtain and help you start to understand the internals of the libraries you work with. If you're curious, you can look at the source code for Figure and FigureBase, and see how real-world Python classes in large projects are implemented. - We can see a list of all the parameters in the definition of
Figure. If you were wondering how flexible afigobject is, this gives you a sense of what attributes can be defined and modified. - Definitions: Here, we learn that
figis a top level container for all the plot elements. - We also get another reference for further research. We can look up
matplotlib.figureto see information about all the methods that can be called throughfig. - We get a full list and description of all the parameters associated with
Figureobjects, along with their default values.
There's much more information in the full version of the help output.
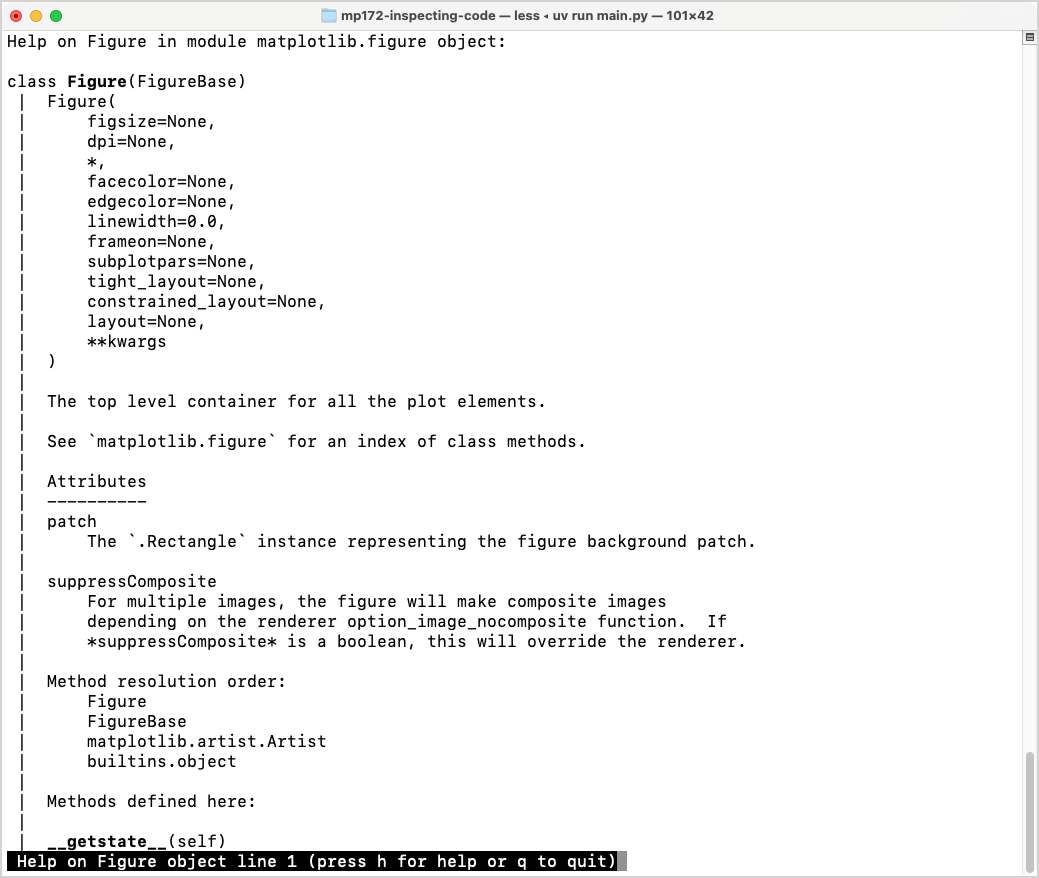
help() on the fig object gives you so much useful information!Calling help() on ax gives similarly useful information:
(Pdb) help(ax)
Help on Axes in module matplotlib.axes._axes object:

class Axes(matplotlib.axes._base._AxesBase)
 |  Axes(
 |      ...
 |  )
 |
 |  An Axes object encapsulates all the elements of an individual (sub-)plot in
 |  a figure.
 |
 |  It contains most of the (sub-)plot elements: `~.axis.Axis`,
 |  `~.axis.Tick`, `~.lines.Line2D`, `~.text.Text`, `~.patches.Polygon`, etc.,
 |  and sets the coordinate system.
 |
 |  ...
 |
 |  .. note::
 |
 |      As a user, you do not instantiate Axes directly, but use Axes creation
 |      methods instead; e.g. from `.pyplot` or `.Figure`:
 |      `~.pyplot.subplots`, `~.pyplot.subplot_mosaic` or `.Figure.add_axes`.
 ...
This was really helpful for me the first time I saw it. Here are my biggest takeaways:
- The
Axesclass encapsulates all the elements of an individual (sub-)plot in a figure. Because of the name Axes, I thought this class just represented the x-axis and y-axis on a standard plot. I had no idea until I read this output that anaxobject really represents a single plot in the overall figure that's being generated. - There are a number of useful elements we can access through
ax: individual axis objects, tick marks, lines, text, and more. - The note is really helpful; as end users of Matplotlib, we don't make our own
Axesinstances. They're instantiated through methods likesubplots(). Runninghelp(ax)was one of my first insights into whatsubplots()was really doing in plotting code.
Conclusions
That's a lot of information, and we never even left the terminal! If you're a Matplotlib user, consider visiting the documentation with a bit more focus. Here's the documentation for the Figure class, and for the Axes class. Most of what you see on those two pages can be accessed through the fig and ax objects that subplots() returns.
If you're not a Matplotlib user, I encourage you to put a breakpoint in after the lines of code you'd like to know more about, and poke around at the objects that exist at that point in your program. Call help() on the objects you're curious about, and see where it leads you.
Also, when you're writing your own code, pay attention to your docstrings. That's where a lot of this information is pulled from.