Debugging in Python, part 15: Final takeaways

MP 159: What did we learn about debugging from this series? What can you do to continue this work?
Note: This post is part of an ongoing series about debugging in Python. The posts in this series will only be available to paid subscribers for the first 6 weeks. After that they will be available to everyone. Thank you to everyone who supports my ongoing work on Mostly Python.
We've come a long way in this series! We've progressed from a single bug in a single file with a fairly clear root cause, to more complex bugs that require gathering information and thinking through the logical flow of a larger project. In this final post we'll review some takeaways, and offer some ways to continue some of the work that was started in this series.
Debugging takeaways
Debugging is something that every programmer spends a significant amount of their time doing; most of us probably started our debugging journey the day we wrote our first program. Despite that, a lot of people haven't developed specific strategies for debugging. There's no one approach to debugging; rather, we have to build a toolbox of approaches and use a strategy that suits the situation we're currently facing.
Print debugging works sometimes
People look down on print debugging, and for good reason. Sprinkling print() calls into your codebase can work, but it's slow and inefficient compared to most other debugging approaches. Using a debugger gives you all the insight that print() calls do, with a lot more flexibility to poke around at what your code is doing.
That said, sometimes all you need is to check the state of your program at one point in its execution, and a simple print() call is enough to diagnose and fix an issue. This usually happens when you already have a pretty good idea about the root cause of an issue, and the likely fix. When you're in this kind of situation, go ahead and throw in a print() call or two. Just move on to a different approach if things turn out to not be as simple as you originally thought.
Python's built-in debugger is fantastic
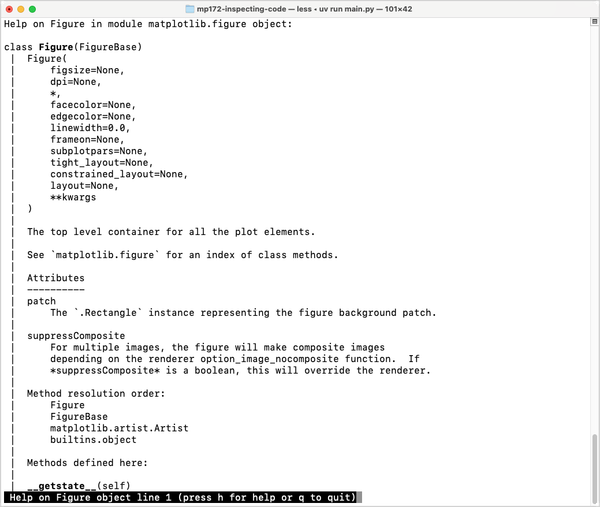
It used to be more work to set up and use a Python debugging session. These days, you can just drop in a call to breakpoint() in your codebase, run your project, and you'll be dropped into a debugging session at that point in your code's execution. You can see the state of every variable in your project, and run code as well. You can step through your project's code in a variety of ways, and try new approaches that aren't currently implemented in your codebase.
Once you get comfortable working in debugging sessions, they become development tools as much as debugging tools. Even when you're not dealing with any bugs, it's helpful to add a breakpoint at the point where you're working in a file, work out your code in a terminal session with all the context of your running program, and then copy that working code into your project. This can be much more efficient than writing what you think might work, then running it, and iterating on your code.
There's no substitute for an IDE debugger sometimes
I love terminal debugging sessions using breakpoints. However, there are times where an IDE's debugger is much more powerful in finding and sorting a bug. The main advantage of an IDE's debugger over a pdb session is that you can see the state of a bunch of variables at once. This is most helpful for more complex bugs, where you're not sure what to look for, or where you need to examine the state of a number of variables at once. In an IDE debugger, you also have a wider variety of ways to step through your code, and examine specific parts of the program's execution.
Let yourself be a detective
There's no one "debugging technique". You have to consider what's supposed to happen when a program runs, and what actually happens. Then you need to use a variety of tools and techniques to get enough information and understanding to identify the root cause of an issue. If you're debugging an issue that someone else ran into, then effective communication skills are important.
AI assistants are a tool like any other. Sometimes they'll identify a cause and a fix immediately, but they can't fix everything. You have to give them enough context to help you find the issue, and you have to evaluate whether they've focused on the right thing, or a related symptom. One of the interesting things about using AI assistants is that the communication skills you develop working with actual users tends to carry over to working well with AI assistants as well.
Write tests!
There wasn't space to address it in this series, but tests should absolutely be a part of your debugging process, even if your project doesn't have an existing test suite. When you first recognize a bug, write a test for what should happen. That test should fail, assuming you haven't fixed the bug yet. It should pass once you fix the bug, and including it in your test suite means you should never see this same bug again.
You might see another variation of this bug at some point, but you shouldn't see the same exact bug again. If you do see a variation of this bug, you can probably expand the test to address that bug as well. Sometimes, writing a test related to a specific bug helps identify the underlying cause, and helps you prevent a whole class of similar bugs from ever appearing.
Expanding on this work
To practice debugging, you need a project to work on. For the final posts of this series, we focused on a terminal-based Go Fish game. If you're looking for something to focus on, there are many loose ends with this project that you could pick up on:
- There's a bug with card validation: you can ask for a card with a rank of 0, or a rank of 1. Can you validate against those guesses?
- There's a bug with assessing games that result in a tie. Can you find it? Can you fix it?
- There's plenty of room for refactoring. How would you do a better job of structuring the project? (There are a number of significant changes I'd make if this were a real-world coding project, rather than a teaching example.)
- Can you implement a strategy for the computer's turns? Right now it's just guessing cards randomly each time. Can you track guesses the player has made, and use those to target likely matches? Can you make two computer players play against each other, and evaluate the effectiveness of various strategies?
- Can you write a test suite for the project?
- Can you make a better user interface, using a library like Textual or Pygame?
- Can you build out a collection of games such as Gin and Poker?
- Can you implement a scoring system, and track scores across a session, and across multiple sessions?
- Can you suppress output and see if you can auto-play a million games? At what point does the project break down? How can you expand that limit?
- Run a memory profiler across 10, 100, or 1,000 games. Is memory usage constant, or does it grow with the number of games? If it grows, can you find the cause and make it more efficient?
If you're interested in trying any of these, start with this version of the project. If you try any of these exercises, you'll almost certainly learn some new skills, and get some debugging practice as well.
Expanding py-bugger
The first posts in the series used py-bugger to introduce specific kinds of bugs into projects, in order to practice debugging in a controlled way. I will continue to develop py-bugger, and I look forward to implementing support for introducing logical errors into a project.
Conclusions
I've always enjoyed debugging work, but I didn't spend much time thinking about my own process until recently. I'm embarrassed to admit how long I went in my programming career using nothing more than print debugging. Writing this series has helped me examine and refine my own debugging practice, and I enjoy the process even more now. I hope you've enjoyed the series as well, and hope you have some good takeaways for refining your own practice.