Minimal reproducible examples

MP 148: How small can a minimum reproducible example be?
Note: My workload has increased over the last month, and I haven't had time to finish the current debugging series. It should be wrapped up in a few more posts, and those posts should come out over the next month or so. This post is about a debugging issue that recently came up in my work, but isn't part of the ongoing series.
Someone recently asked for help running a program that uses Plotly. The program is supposed to generate a simple bar graph, which is then displayed in a browser window. Instead of showing a plot, their program just dumped a bunch of HTML and JavaScript code to the terminal. They weren't sure what to make of it, and wanted to know what went wrong.
Issues like this can be complex to sort out, because there are so many different factors. Figuring out the root cause of a programming problem isn't always the end of the troubleshooting. Sometimes there's more work to do in figuring out a fix that works on your system. In those situations, it's easier to work with a much smaller program that results in the same issue. Sometimes that smaller example is much smaller and simpler than you might expect.
Expected output
The person who wrote asking for help was trying to run die_visual.py, a program from Python Crash Course. It simulates rolling a single die 1,000 times, and generates a bar graph showing the results of those rolls.
Here's the last few lines of die_visual.py:
...
# Visualize the results.
title = "Results of Rolling One D6 1,000 Times"
labels = {'x': 'Result', 'y': 'Frequency of Result'}
fig = px.bar(x=poss_results, y=frequencies, title=title, labels=labels)
fig.show()
The first part of the program, not shown here, generates the data. The block shown here generates a visualization based on that data. The last line, fig.show(), should open a browser window where the plot is displayed.
Here's what you should see in the terminal when you run that program:
$ python die_visual.py
$
That's it; when the program runs successfully, there shouldn't be any output. Instead, you should see a new browser window open up:
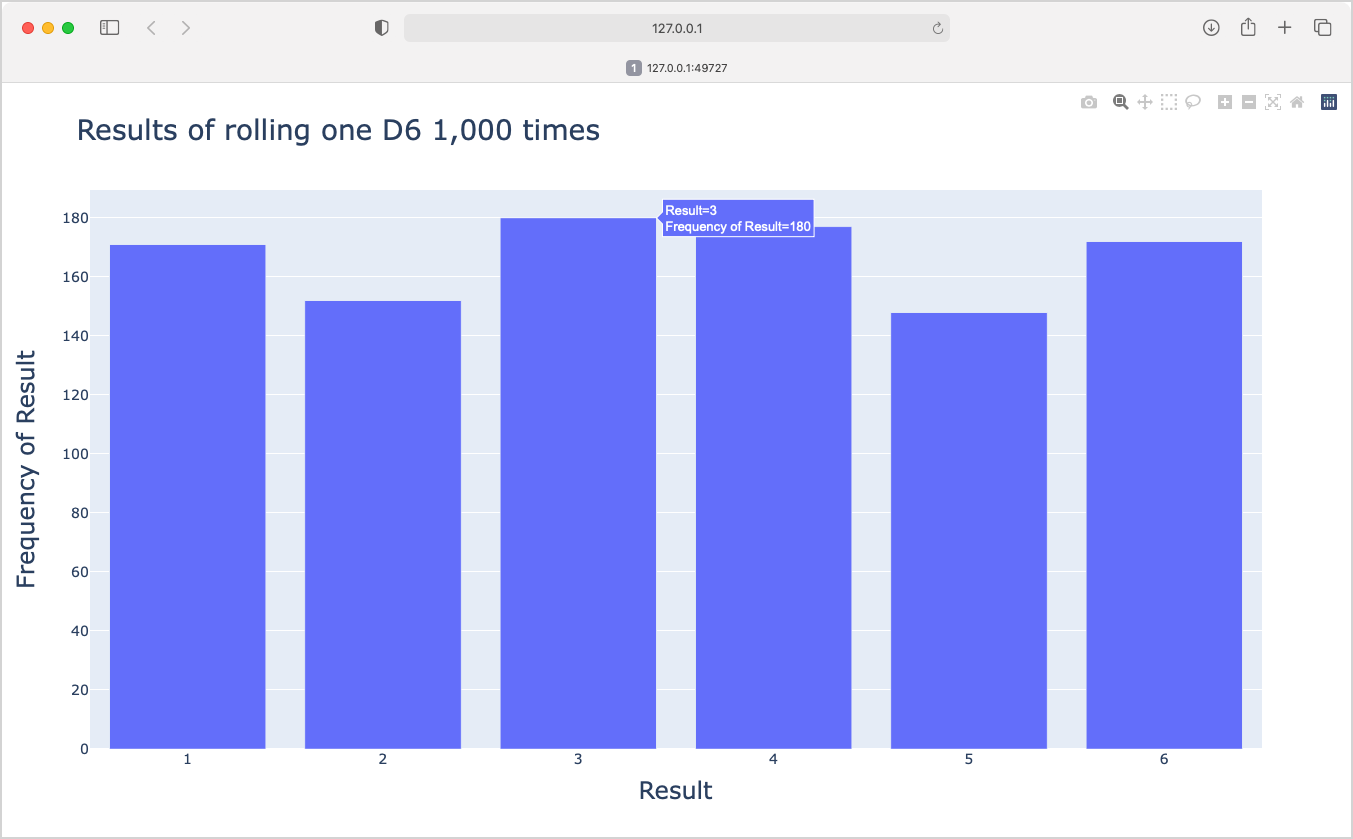
fig.show() should open the plot in a new browser window.It's a fairly simple program. In the book, the project moves on to generate more interesting plots based on rolling multiple dice of different sizes.
Unexpected output
When the reader ran this program, this is roughly what they saw:
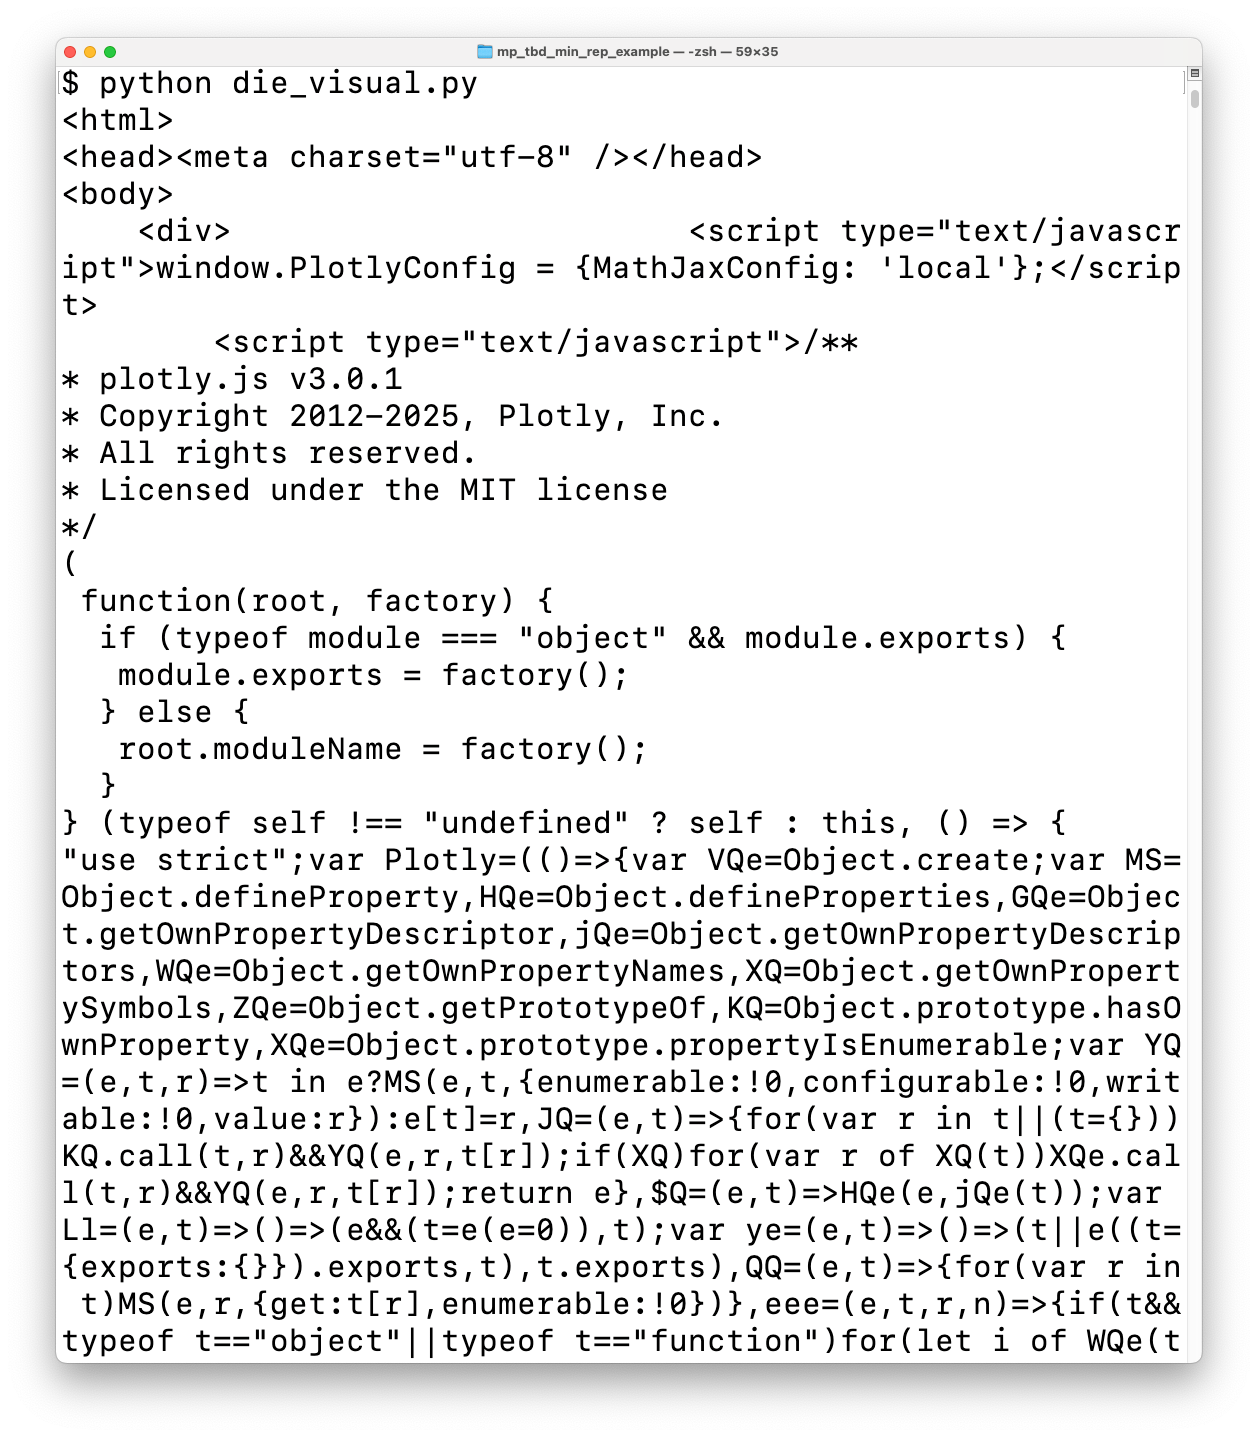
I've seen output like this before, but I couldn't remember what made it happen. With a bit of digging, I remembered what was probably going on. Plotly's output is rendered as an HTML page, with a bunch of JavaScript to control the interactivity in the rendered plot. If Plotly can't open a browser tab, it dumps the HTML as output. That's what this reader was seeing in their terminal.
The root cause
Here's the snippet of Plotly code that tries to open the generated plot in a browser window:
def write_html(...):
    ...
    # Handle auto_open
    if path is not None and full_html and auto_open:
        url = path.absolute().as_uri()
        webbrowser.open(url)
After plotly generates the HTML representing the plot, it calls webbrowser.open() if the auto_open flag is True. When you call fig.show(), auto_open is set to True, which causes the plot to appear in a browser window.
A minimal reproducible example
If you're unfamiliar with the term, a minimal reproducible example is a much smaller program that results in the same issue you're seeing when working with your actual project. The project you're working on almost always has a lot of code and context that isn't directly related to the issue you're facing. Creating a minimal reproducible example simplifies your own troubleshooting work, and is really important when asking others for help. Most people don't usually have the time to sort through your entire codebase, but they can help troubleshoot a much smaller example.
The HTML and JavaScript are being dumped to the terminal because webbrowser.open() isn't working in the environment where this person was running die_visual.py. They could run die_visual.py repeatedly in an effort to figure out which conditions allow it to show the plot, and which conditions force it to dump HTML as output. But it's annoying to have to copy the two files for this project, and make sure Plotly and pandas are installed whenever you're trying to run the program in a new way. Also, the HTML output from this program is over 4.5 million characters long; that's over 50,000 lines of standard terminal output!
It would be much nicer to have a small example program to figure out how to run Plotly programs successfully. It turns out you can write a two-line snippet that tests the core issue:
import webbrowser
webbrowser.open("https://python.org")
This short program imports the webbrowser module, and then calls open() with Python's home page as the target. This should work for figuring out how to get Plotly to run successfully on the user's system. If we can get this program to run, we should be able to get Plotly to open its plots correctly. Working with this program is much simpler than working with even the tiniest Plotly program. It also means there's nothing to install, and no irrelevant output to skim over.
One more advantage of a tiny minimal example like this is that you don't even need a .py file. You can run this snippet in a terminal session:
$ python
>>> import webbrowser as wb
>>> wb.open("https://python.org")
You can try this snippet in any number of ways; in an existing virtual environment, in a fresh virtual environment, outside a virtual environment, in a terminal embedded in an IDE, and more.
Conclusions
Debugging can be hard, and troubleshooting issues related to your environment can be especially confusing. Troubleshooting is much easier if you can come up with a small program that reproduces the root issue, rather than having to work with a larger project.
If the troubleshooting you're doing involves a large codebase, or a project with multiple dependencies, see if you can write a much smaller program that reproduces the same issue. You can start by stripping down the project to its barest parts. Try things like using a much smaller dataset, stripping all formatting-related work, and removing libraries that don't seem to be involved. Even if you don't get to a tiny program like the one shown here, every simplification you can make while still reproducing the core issue will make your debugging work easier and more likely to succeed.
Resources
Resources used in this post can be found in the mostly_python GitHub repository.