Debugging in Python, part 6: Tracebacks with dependencies

MP 145: Why third-party code appears in tracebacks, and what you can learn from it.
Note: This post is part of an ongoing series about debugging in Python. The posts in this series will only be available to paid subscribers for the first 6 weeks. After that they will be available to everyone. Thank you to everyone who supports my ongoing work on Mostly Python.
The code we've focused on so far in this series didn't have any external dependencies. But that's not representative of most real-world Python code; almost all the code we write relies on multiple third-party packages.
When your project doesn't have any dependencies, everything in a traceback relates to code you've written. When you're using third-party packages, code from those dependencies can show up in a traceback. While most bugs come from our own code, the presence of these extra lines in the traceback can make the debugging process seem more complicated.
In this post we'll introduce some errors into a small program that uses two third-party packages. We'll look at how code from a dependency can show up in a traceback, and see how to make sense of the increased volume of information.
Diving further into music
I've been learning piano for a little while now, and a lot of the disconnected ideas I learned about music when I was younger are starting to make sense for the first time. Inspired by that, I recently picked up an electric guitar. I tried to learn when I was younger, but I didn't really know how to learn, I didn't know how to practice, and there were no musical people in my immediate sphere. Things feel different now, and I feel like I might finally be able to play well.

When I was younger I just wanted to play metal. But as an adult people who play really well with a clean tone have grabbed my attention. So I picked up an entry-level Strat-style guitar. (Today's entry-level guitars are way nicer than entry-level instruments in the 80s.) It's been so much fun to play, and I'm understanding it much better than I used to.
Someone recently asked about how to visualize people's attendance in a meeting. After making a quick demo plot in response to that question, I wanted to build a visualization of the lifespans of the famous Fender Strat players I was starting to pay more attention to.
Player lifespans
A visualization like this is a slightly customized horizontal bar chart. First, we need some data; here's the code representing the data for each player:
from datetime import datetime

import pandas as pd

# End date for players who are still living.
today = datetime.today().strftime("%m/%d/%Y")

df = pd.DataFrame([
    {"name": "Buddy Guy", "start": "6/30/1936", "end": today},
    {"name": "Buddy Holly", "start": "9/7/1936", "end": "2/3/1959"},
    ...
])
We use today's date as the end date for every player who's still living. Each player is then a single row in a pandas dataframe.
Here's the code that generates the visualization:
from datetime import datetime

import plotly.express as px

import player_data

# Generate plot.
fig = px.timeline(
    player_data.df,
    x_start="start",
    x_end="end",
    y="name",
)

# Customize plot.
fig.update_yaxes(autorange="reversed")

fig.update_layout(title="Fender Strat players")
fig.update_layout(yaxis_title=None)

fig.update_traces(marker_color='SteelBlue')
fig.update_traces(marker_opacity=0.6)

fig.show()
Plotly has a timeline() function that generates a horizontal bar chart, structured as a timeline. Here's the resulting plot:
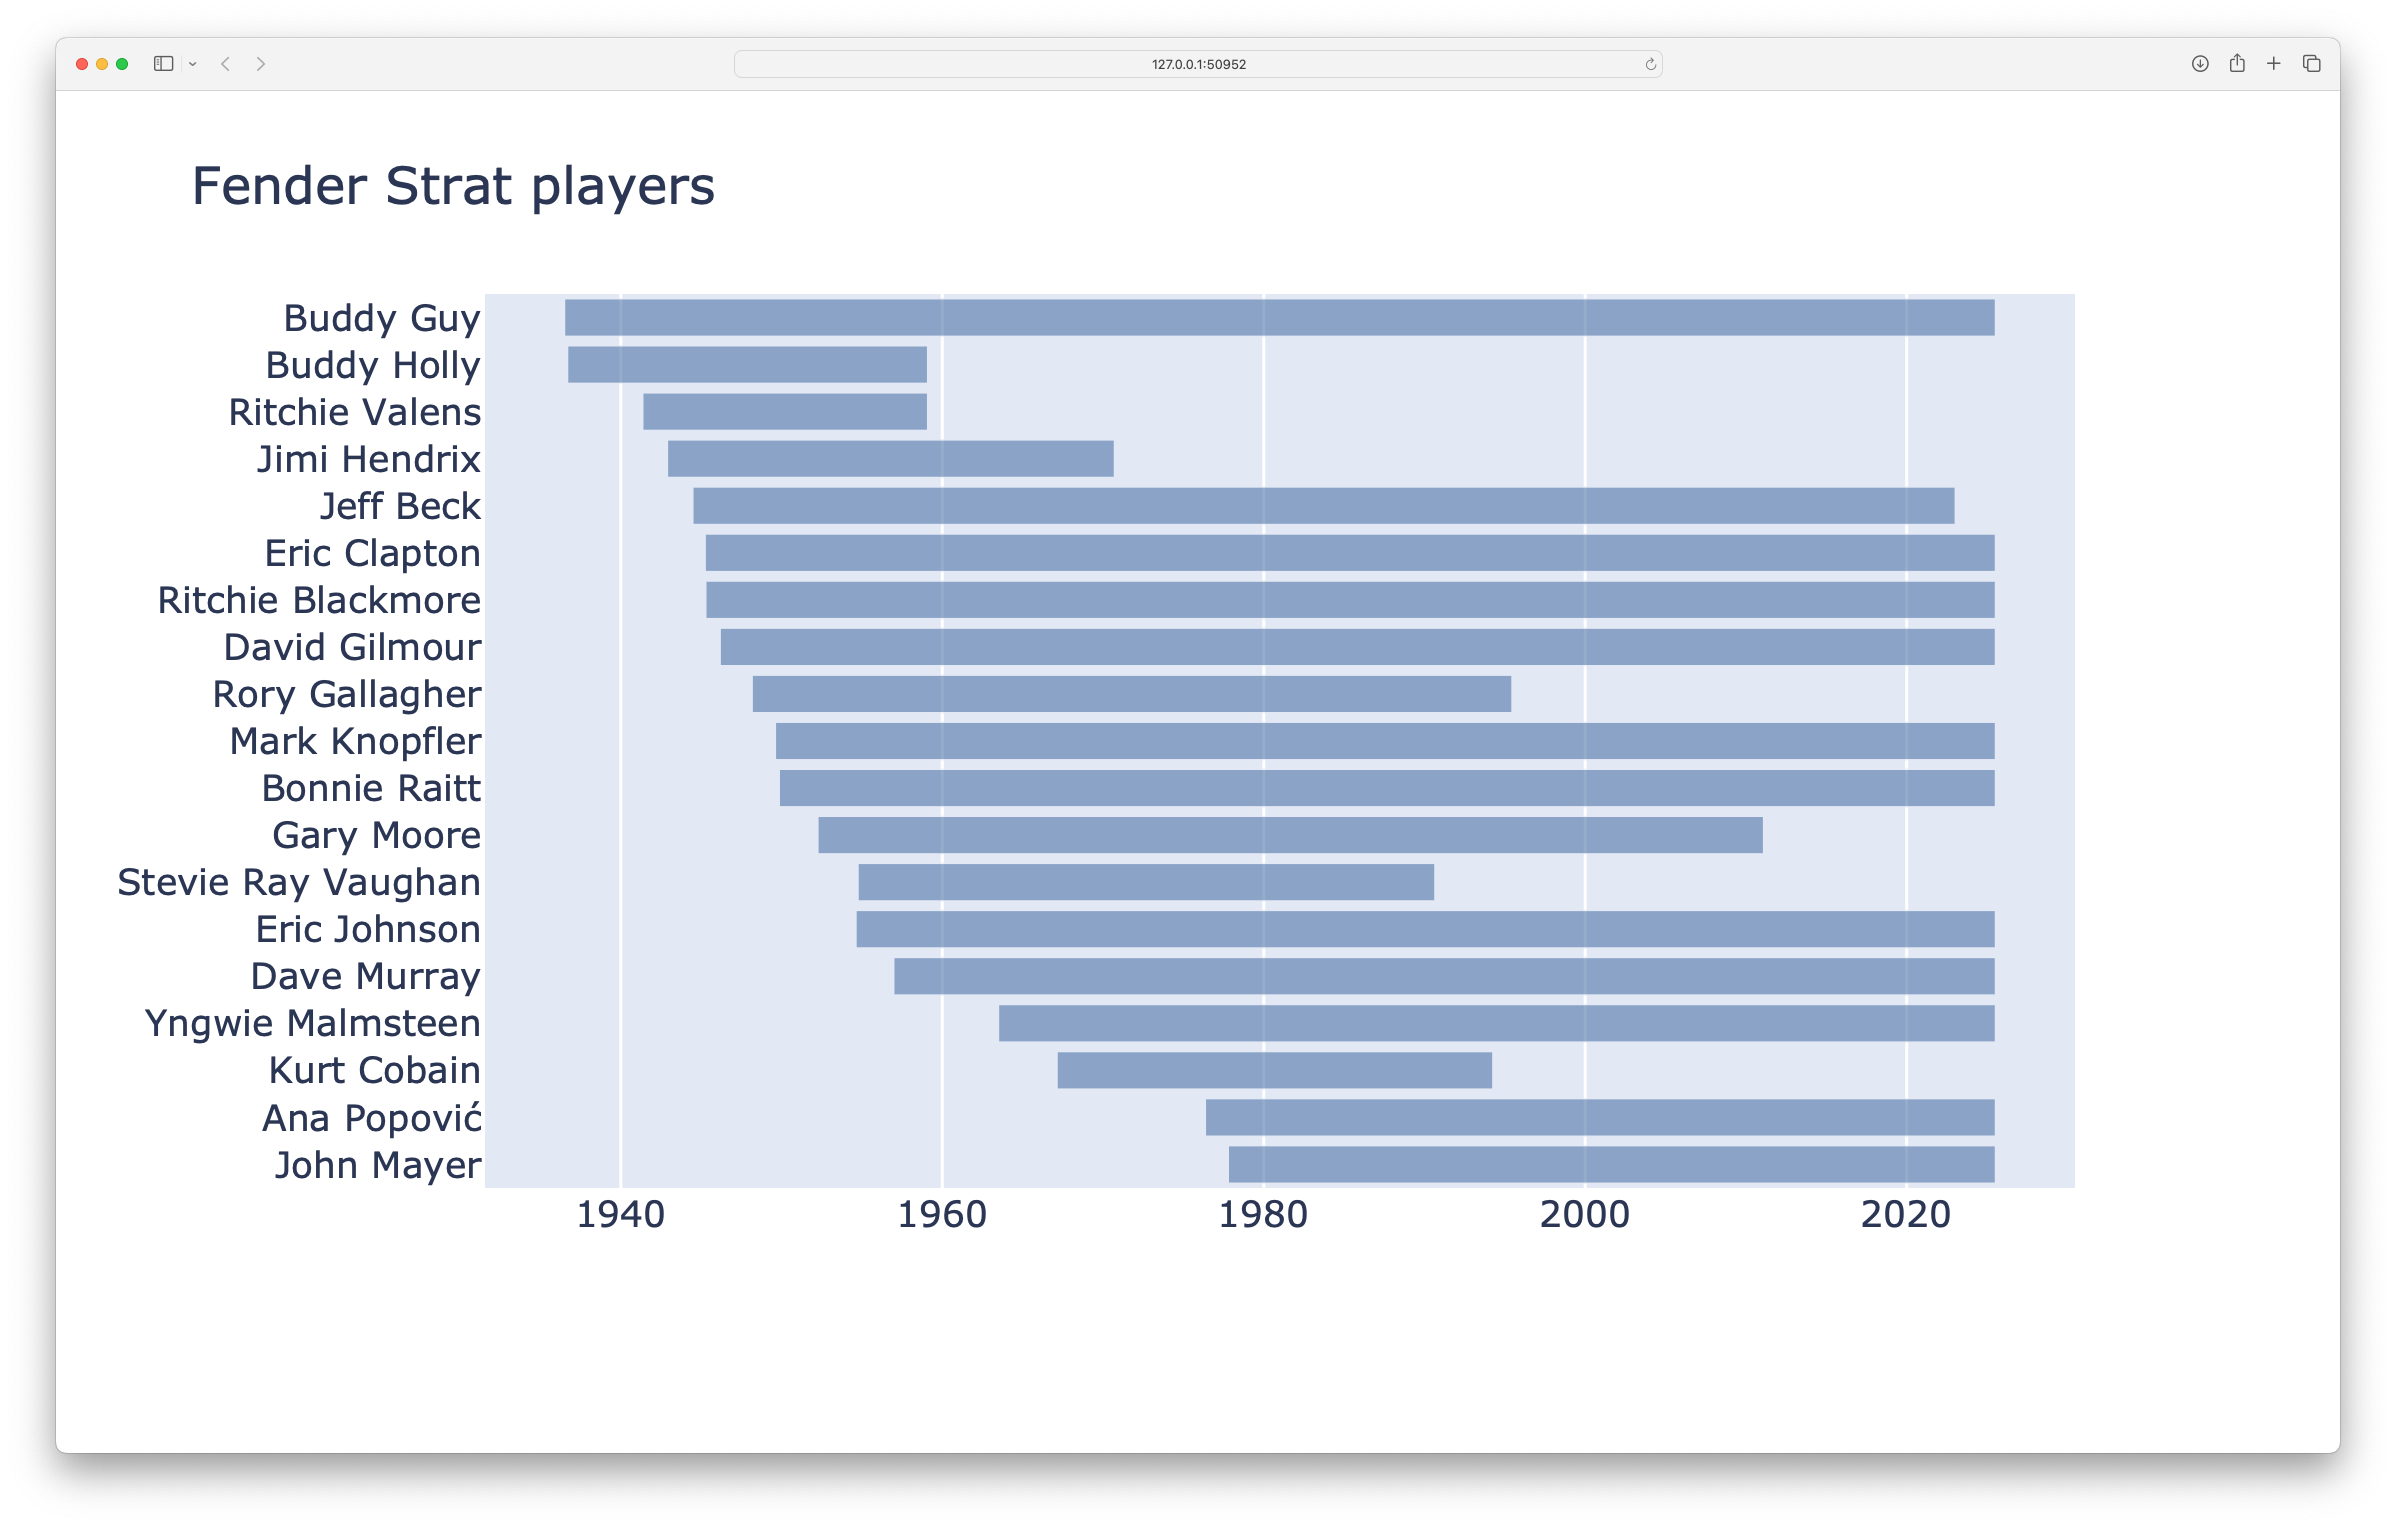
The visualization shows that many of the most famous Strat players are still alive, although several have led tragically short lives. This was a fun little investigation, and it's led me to a bunch of new music to listen to.
Introducing a bug
For most of this series, we've been trying to introduce random bugs into the example projects. This time, I'm going to make a specific change to the codebase to make sure the resulting issue involves some of the dependencies' code.
Let's change two of the arguments in the call to px.timeline():
fig = px.timeline(
    player_data.df,
    x_start="birth",
    x_end="death",
    y="name",
)
Here I've used the names "birth" and "death" instead of "start" and "end". This a common kind of mistake, especially when the source data is in a separate file.
Here's the result of running the code after making this change:
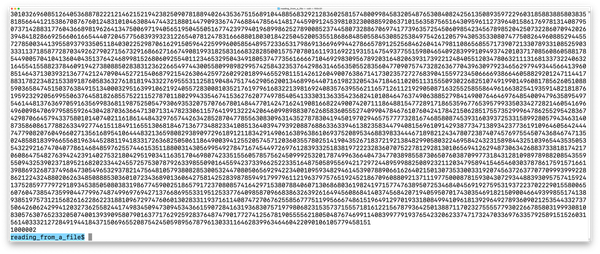
$ python strat_players.py
Traceback (most recent call last):
  File "strat_players.py", line 8, in <module>
    fig = px.timeline(
          ^^^^^^^^^^^^
  File ".venv/.../plotly/express/_chart_types.py", line 432, in timeline
    return make_figure(
           ^^^^^^^^^^^^
  File ".venv/.../plotly/express/_core.py", line 2491, in make_figure
    args = build_dataframe(args, constructor)
           ^^^^^^^^^^^^^^^^^^^^^^^^^^^^^^^^^^
  File ".venv/.../plotly/express/_core.py", line 1737, in build_dataframe
    df_output, wide_id_vars = process_args_into_dataframe(
                              ^^^^^^^^^^^^^^^^^^^^^^^^^^^^
  File ".venv/.../plotly/express/_core.py", line 1338, in process_args_into_dataframe
    raise ValueError(err_msg)
ValueError: Value of 'x_start' is not the name of a column in 'data_frame'.
  Expected one of ['name', 'start', 'end'] but received: birth
This is the longest traceback we've seen, and it includes code that we didn't write. Even though we already know what the cause of the traceback is, let's go through it one section at a time.
Reading a traceback with third-party code
Like every other traceback we've looked at, we'll start by working backwards from the end:
$ python strat_players.py Traceback (most recent call last):
  ...
  File ".venv/.../plotly/express/_core.py", line 1338, in process_args_into_dataframe
    raise ValueError(err_msg)
ValueError: Value of 'x_start' is not the name of a column in 'data_frame'.
  Expected one of ['name', 'start', 'end'] but received: birth
The exception that's raised is a ValueError. It's generated by a file called _core.py, in Plotly Express code. The error is raised when Plotly tries to run a function called process_args_into_dataframe().
This is a fantastic error message. It tells us exactly what the problem is: the value we provided for the argument x_start is not in the dataframe we're using. Plotly found three columns: "name", "start", and "end". It reminds us that we passed the name birth. If this was an unexpected bug, this is probably enough information to fix the problem without even visiting the data file, or reading any more of the traceback.
Reading from the beginning
Let's pretend we don't know the cause of the issue, and we want to understand the overall traceback. It's not unusual for an error to be raised from within third-party code. This rarely indicates a bug in the actual third-party code; it usually means we're not using the third-party code correctly.
In a traceback of this length, you can keep reading upward through the traceback. But in many real-world situations, you'll end up skimming a bunch of third-party code that probably isn't critical to the error. At this point, you can jump back to the beginning of the traceback. This will start you on the path through your own code that ended up causing an issue.
Let's look at the traceback from the beginning:
$ python strat_players.py
Traceback (most recent call last):
  File "strat_players.py", line 8, in <module>
    fig = px.timeline(
          ^^^^^^^^^^^^
  ...
The first part of the traceback includes the main .py file that we executed, in this case strat_players.py. This is the only line from our code that's included in the traceback. The call to px.timeline() is the call that reaches out from our code to third-party code, so the rest of the traceback walks through third-party code.
This part of the traceback tells us that the call to px.timeline() might be part of the problem, but it's not enough to diagnose the issue.
Following the path through third-party code
The next section jumps into third-party code:
$ python strat_players.py
Traceback (most recent call last):
  ...
  File ".venv/.../plotly/express/_chart_types.py", line 432, in timeline
    return make_figure(
           ^^^^^^^^^^^^
  ...
A clear indication that the traceback has moved into third-party code is the presence of paths that include .venv. Here execution has jumped into a file called _chart types.py. The traceback highlights line 432, but notice where this code is from: in timeline. This is pointing to line 432 in the function timeline(), in Plotly Express code.
Stopping to look at the code referenced in this section of the traceback highlights how much you can learn from the debugging process. Let's take a moment to look at the timeline() function:
def timeline(
    data_frame=None,
    x_start=None,
    x_end=None,
    y=None,
    ...
) -> go.Figure:
    """
    In a timeline plot, each row of `data_frame` is represented as a rectangular
    mark on an x axis of type `date`, spanning from `x_start` to `x_end`.
    """
    return make_figure(
        args=locals(),
        constructor="timeline",
        trace_patch=dict(textposition="auto", orientation="h"),
        layout_patch=dict(barmode="overlay"),
    )
We can certainly fix this bug without paying much attention to Plotly's internals. But if you're curious about how the libraries you use on a regular basis are implemented, visiting the specific sections of the codebase that your project uses is a great place to start.
Here the timeline() function is a wrapper around a call to make_figure(). I almost always learn something by looking at the implementation of a function like this. Scanning through the list of arguments for timeline() and their default values, I notice a lot of customizations I could make directly in the call to timeline(). I've used Plotly for a while now, but it's a large library. Plotly's documentation is fantastic, but different things stand out to me when I visit the documentation for a function like timeline(), and the actual code for that function. Looking at the library in different ways gives me a much better understanding of how I can work with it in this project, and in other projects as well.
The next section points to the code in make_figure():
$ python strat_players.py
Traceback (most recent call last):
  ...
  File ".venv/.../plotly/express/_core.py", line 2491, in make_figure
    args = build_dataframe(args, constructor)
           ^^^^^^^^^^^^^^^^^^^^^^^^^^^^^^^^^^
  ...
The implementation of make_figure() is over 300 lines long. Again, we don't need to dig into the internals for our current debugging work, but it's interesting to take a quick look at that code. Seeing long functions like this in well-used libraries always makes me feel better when my own functions grow a bit longer than I think they should.
Plotly's make_figure() runs into trouble when it calls out to build_dataframe(). The next section points to a line in that function:
$ python strat_players.py
Traceback (most recent call last):
  ...
  File ".venv/.../plotly/express/_core.py", line 1737, in build_dataframe
    df_output, wide_id_vars = process_args_into_dataframe(
                              ^^^^^^^^^^^^^^^^^^^^^^^^^^^^
  ...
This is another really long function, which unsuccessfully calls process_args_into_dataframe(). Now we're back to the end of the traceback, where we started:
$ python strat_players.py
Traceback (most recent call last):
  ...
  File ".venv/.../plotly/express/_core.py", line 1338, in process_args_into_dataframe
    raise ValueError(err_msg)
ValueError: Value of 'x_start' is not the name of a column in 'data_frame'.
  Expected one of ['name', 'start', 'end'] but received: birth
The function process_args_into_dataframe() is another long one, but let's look at the line that raises the ValueError, with a bit of context:
# Check validity of column name
elif argument not in df_input.columns:
    if wide_mode and argument in (value_name, var_name):
        continue
    else:
        err_msg = (
            "Value of '%s' is not the name of a column in 'data_frame'. "
            "Expected one of %s but received: %s"
            % (field, str(list(df_input.columns)), argument)
        )
        ...
        raise ValueError(err_msg)
This is in a section of code that checks for valid dataframe column names. If the name referred to by argument is not in df_input.columns, then it's probably an error. The else block here runs in our example, and we can see exactly how the final error message is constructed.
Conclusions
A lot of the initial work in debugging centers around making sense of the error messages and tracebacks that show up. You rarely need to look at the source code mentioned in every section of a traceback. But understanding what all those parts mean, and what you can learn by visiting them, is really helpful in building a mental model of what happens during the execution of a moderately complex codebase. When you see a traceback that's particularly long, keep in mind that most of that output is showing you the execution path that lead to the error.
If you're curious to see what kinds of errors cause third-party code to be brought into a traceback, download the files for this project and see if you can make a different change that causes a traceback like the one discussed here. Then, see if you can make a change that causes a traceback that doesn't involve any third-party code.
The next time you see a long traceback in your own work, see if you can visualize the sections of the traceback that involve your code, and the sections that involve third-party code. This helps turn what used to be a wall of text into something that you can efficiently make sense of, and put to good use in your debugging work.
Finally, I always encourage people to read through third-party code whenever you have the chance. You'll learn a lot about the libraries you use, and you'll pick up a variety of programming techniques as well. The more you learn about the logical flow of complex execution paths, the less intimidating a lot of programming work, including debugging, will be.
In the next post, we'll look at a situation where the bug is actually in the third-party code. It's a less common scenario, but an important one to be aware of. If you can become comfortable poking around third-party code, you might find yourself contributing back to the dependencies you use.